Jubilant Ingrevia: The Recovery Is Real but Not Complete
Revenue and PAT remain below FY22, but margins and operating cash flow have improved from the FY24 trough. Debt is the unfinished part.

Jubilant Ingrevia’s recovery is visible in higher revenue, profit, margins and operating cash flow from the FY24 trough. It is not complete because FY26 revenue and PAT remained below FY22, while gross borrowings were still elevated.
Turnarounds are easiest to see after they are finished. The difficult and more useful part is recognising what an incomplete recovery looks like.
Jubilant Ingrevia’s FY26 numbers offer a clear example. The direction underneath the headline has changed, but the earlier earnings level has not yet been restored.
The recovery is visible in the accounts, but it still has work to do.
The five-year shape
The chart indexes FY22 to 100 so revenue, PAT and operating cash flow can be compared despite their different rupee scales.
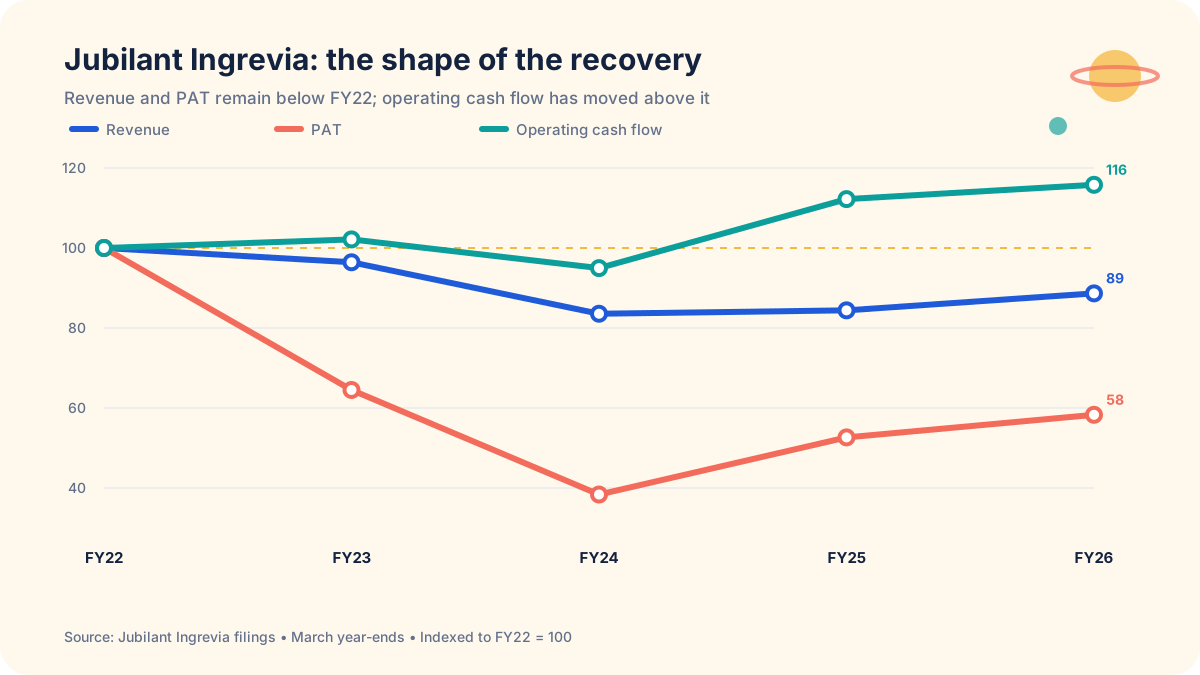
Source: Jubilant Ingrevia consolidated annual results and cash-flow statements for FY22 to FY26. FY25 PAT is the company-reported ₹251 crore. Index calculated on 10 August 2026.
Revenue declined through FY24 and has since begun to recover. PAT fell much more sharply and has recovered more quickly from its low, but remains far below FY22. Operating cash flow followed a steadier path and reached a five-year high in FY26.
The absolute figures make the story concrete:
| Metric | FY22 | FY24 | FY26 |
|---|---|---|---|
| Revenue | ₹4,949.36 crore | ₹4,135.80 crore | ₹4,388.07 crore |
| PAT | ₹476.71 crore | ₹182.89 crore | ₹277.91 crore |
| Operating cash flow | ₹452.74 crore | ₹429.98 crore | ₹524.27 crore |
| Gross borrowings | ₹228.75 crore | ₹733.00 crore | ₹791.81 crore |
| Cash and equivalents | ₹37.61 crore | ₹78.78 crore | ₹188.47 crore |
Source: Jubilant Ingrevia consolidated financial statements for the years ended 31 March 2022, 31 March 2024 and 31 March 2026, accessed through company investor disclosures by 10 August 2026. Figures are rounded to two decimals.
What has recovered
FY24 is the useful trough from which to measure the present improvement.
Between FY24 and FY26, based on the consolidated figures above:
- Revenue increased 6.1%.
- PAT increased 52.0%.
- Operating cash flow increased 21.9%.
Profit rising much faster than revenue tells us that the recovery was not merely more volume passing through the same economics. Net margin improved too.
| Margin | FY24 | FY26 | Change |
|---|---|---|---|
| Net margin | 4.4% | 6.3% | +1.9 percentage points |
Source: PAT divided by revenue from Jubilant Ingrevia’s consolidated FY24 and FY26 results, calculated on 10 August 2026.
That is meaningful. A business that earns more from each rupee of revenue has more room to absorb volatility, reinvest and service its obligations.
Improving and restored are different states.
What has not recovered
FY26 revenue was still 11.3% below FY22. PAT was still 41.7% below FY22, based on the consolidated figures in the three-year table.
That gap matters because a turnaround measured only from the trough can look more complete than it is. The lower the starting point, the more dramatic the growth rate can appear.
The balance sheet also asks for caution.
Gross borrowings rose from ₹733.00 crore in FY24 to ₹791.81 crore in FY26. Cash and equivalents increased from ₹78.78 crore to ₹188.47 crore. Borrowings less cash therefore improved from roughly ₹654 crore to ₹603 crore, calculated from the same consolidated balance sheets.
That is progress in liquidity, not yet clear gross deleveraging.
A cleaner balance-sheet signal would be borrowings falling while operating cash flow remains strong.
The cash-flow signal is the strongest part
FY26 operating cash flow was ₹524.27 crore against PAT of ₹277.91 crore, according to the company’s consolidated FY26 statements.
That is roughly ₹1.89 of operating cash flow for each ₹1 of PAT.
For a single year, that is a healthy pattern. It gives the recovery more substance than an earnings rebound unsupported by cash.
One strong year can still benefit from working-capital timing. The test is whether cash conversion remains sound while revenue grows and the business funds capital expenditure.
A four-part test for the next stage
Jubilant Ingrevia does not need one spectacular number to prove the recovery. It needs several ordinary numbers to keep agreeing.
1. Revenue
FY26 moved above FY24 but remained below FY22. Continued top-line progress would make the margin recovery easier to trust.
2. Margins
Net margin improved from about 4.4% in FY24 to 6.3% in FY26. Holding or extending that gain would show the earnings recovery is durable.
3. Cash conversion
Operating cash flow should continue to track PAT over a multi-year period, not merely through one working-capital release.
4. Borrowings
Strong cash generation becomes more valuable when it begins to reduce gross debt rather than only adding cash to the balance sheet.
The useful middle ground
Investors often force a recovering company into one of two labels: broken or fixed.
The accounts rarely move that cleanly.
Jubilant Ingrevia’s FY26 data sits in the useful middle ground. Revenue has stabilised and begun to rise. Net margin has recovered. PAT and cash flow are moving in the right direction. Yet the business has not regained its FY22 earnings level, and borrowings remain high.
That does not weaken the story. It makes the story measurable.
The next leg will be proven not by the word “turnaround,” but by revenue, margins, cash conversion and borrowings continuing to move together.
Public sources
- Jubilant Ingrevia Q4 and FY26 results, 26 May 2026
- Jubilant Ingrevia investor relations and historical financial disclosures
- Jubilant Ingrevia corporate disclosures
Related reading:
Frequently asked questions
Is Jubilant Ingrevia's recovery complete?
No. FY26 revenue and PAT remained below FY22, and gross borrowings were still elevated. The recovery is visible in higher revenue, profit, margins and operating cash flow from the FY24 trough, but the earlier earnings level has not been restored.
What improved at Jubilant Ingrevia between FY24 and FY26?
Revenue rose about 6%, PAT rose about 52%, net margin improved from roughly 4.4% to 6.3%, and operating cash flow increased about 22%, based on consolidated public filings.
What is the strongest part of the recovery?
Operating cash flow is the clearest support. FY26 operating cash flow was about ₹524 crore against PAT of about ₹278 crore, so reported profit was backed by cash in that year.
What would make the recovery more convincing?
Continued revenue growth, stable or improving margins, durable cash conversion and a decline in gross borrowings would make the recovery broader and more complete.