The Paint Sector's ₹100 Test: Four Financial Fingerprints
Four paint makers reported similar FY26 growth but very different margins and cash conversion. A three-number test shows why one metric is not enough.

Four listed paint makers reported a relatively narrow range of FY26 top-line growth, but their margins and cash conversion were far apart. The useful comparison is therefore not “who grew fastest,” but how much operating profit and cash each company produced from that growth.
Paint is an easy industry to describe and a difficult one to compare.
The tins look similar. Raw materials overlap. Products travel through dealers and reach the same broad set of homes, contractors and industrial customers.
Yet the financial outcome of ₹100 of income can be very different. Product mix, pricing, manufacturing utilisation, distribution density, advertising and working capital all leave fingerprints in the accounts.
The three-number test
Instead of asking which company grew fastest, use three questions:
- How quickly did the top line grow?
- How much operating profit remained from each ₹100 of total income?
- How much operating cash arrived for each ₹1 of EBITDA?
| Company | Total-income growth | PAT growth | EBIT margin | Net margin | CFO / EBITDA |
|---|---|---|---|---|---|
| Asian Paints | 5.3% | 17.9% | 16.6% | 11.9% | 1.08x |
| Berger Paints | 3.0% | -4.5% | 12.5% | 9.4% | 0.87x |
| Indigo Paints | 4.3% | 3.4% | 14.2% | 10.3% | 0.90x |
| Kansai Nerolac | 3.0% | -48.4% | 10.1% | 7.2% | 0.98x |
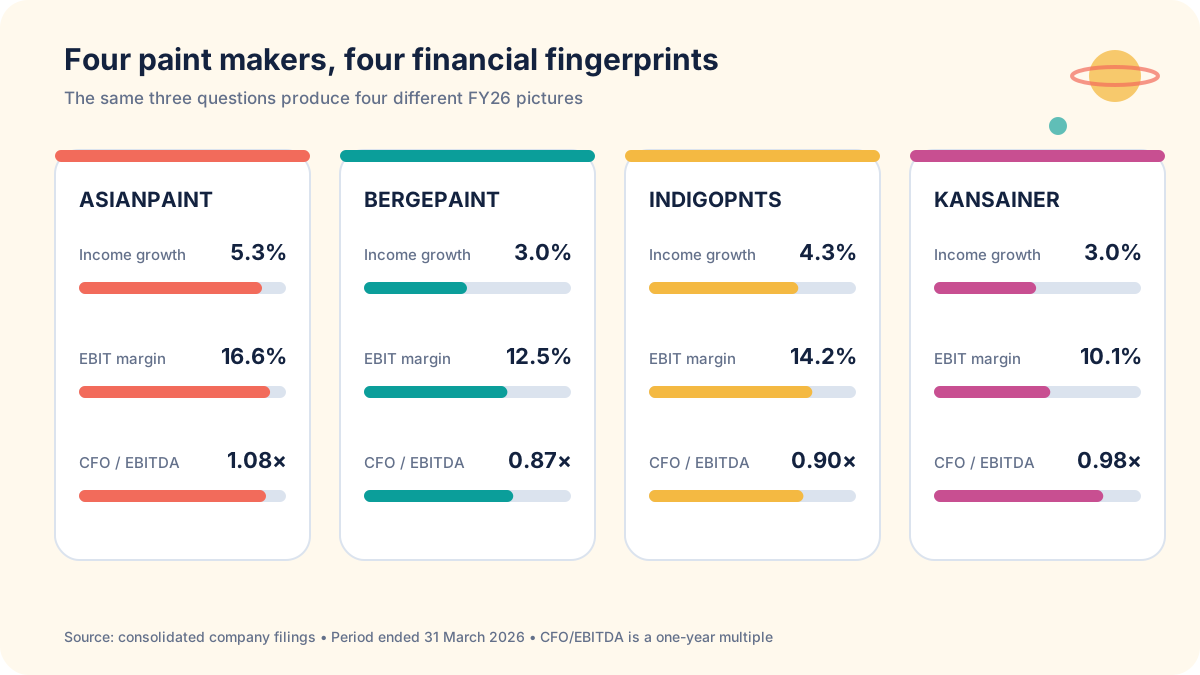
Source: Altys calculations from consolidated FY25 and FY26 results and cash-flow statements filed with NSE or published through company investor relations. Period ended 31 March 2026; calculations dated 10 August 2026. Source links appear below.
This common-period snapshot is not a declaration that one company is permanently better than another. It is a map of what the reported numbers are asking us to investigate.
Fingerprint 1: Growth was clustered, margins were not
Total-income growth ranged from roughly 3.0% to 5.3%. That is a relatively narrow band.
EBIT margins ranged from 10.1% at Kansai Nerolac to 16.6% at Asian Paints, a spread of 6.5 percentage points. These figures come from the consolidated FY26 filings for the year ended 31 March 2026.
For every ₹100 of total income:
- Asian Paints produced about ₹16.60 of EBIT.
- Indigo Paints produced about ₹14.20.
- Berger Paints produced about ₹12.50.
- Kansai Nerolac produced about ₹10.10.
The top-line growth rates alone would make the four businesses look close. The operating-profit outcome says they were not.
That gap can reflect product mix, price realisation, raw-material economics, plant loading, dealer incentives, advertising or organisational cost. The accounts show the size of the gap. They do not, by themselves, assign the cause.
A margin difference is observable. A competitive advantage is an explanation that still needs evidence.
Fingerprint 2: PAT can move very differently from operations
Asian Paints grew total income by 5.3% and PAT by 17.9%. Indigo Paints grew the two lines at broadly similar rates.
Berger Paints grew total income by 3.0% while PAT declined 4.5%. Kansai Nerolac also grew total income by roughly 3.0%, yet PAT fell 48.4%. All four comparisons use consolidated FY25 and FY26 filings available by 10 August 2026.
That last number is a reminder not to stop at a sector-level story. Two companies can face the same broad demand environment and report radically different bottom-line outcomes.
To understand the divergence, bridge EBIT to PAT:
- How did other income change?
- Did finance costs move?
- Were there exceptional items?
- Did the tax rate distort the comparison?
- Was the previous year an unusually strong base?
The statements show where the divergence appeared. The notes explain why.
Fingerprint 3: Cash conversion refuses to form a neat ranking
Operating cash flow divided by EBITDA ranged from 0.87 times to 1.08 times in FY26.
Asian Paints converted ₹1 of EBITDA into about ₹1.08 of operating cash flow. Berger and Indigo were below ₹0.90, while Kansai Nerolac was close to ₹0.98. The calculation uses the consolidated FY26 income and cash-flow statements listed below.
Why can cash conversion exceed one? Working capital can release cash during the year. Why can it fall below one? Inventory, receivables, taxes and other operating balances can absorb it.
Now compare that with CFO/PAT. Kansai Nerolac recorded CFO/PAT of about 1.52 times even though PAT fell sharply.
That does not mean its cash economics were the best in the group. A falling PAT denominator can mechanically lift the ratio. CFO/EBITDA provides a second lens and gives a more ordinary 0.98 times.
Ratios can disagree without either being wrong because they answer different questions:
- CFO/PAT asks how cash compares with bottom-line accounting profit.
- CFO/EBITDA asks how cash compares with operating earnings before depreciation, interest and tax.
- Neither says how much free cash remains after capital expenditure.
The sector’s real comparison is a triangle
A one-number league table hides too much. A better comparison keeps three corners visible.
Growth
Is demand, volume or pricing expanding the top line?
Operating economics
How much EBIT remains from each ₹100 of income, and is the margin stable across raw-material cycles?
Cash
Does operating profit convert into cash without repeated help from working-capital releases?
The strongest business pattern is not necessarily the highest reading on one corner. It is a credible balance across all three, sustained over time.
What the next results need to answer
The FY26 snapshot creates a practical watchlist:
- Does Asian Paints retain its margin level while growing the top line?
- Can Berger move cash conversion above one without sacrificing growth?
- Can Indigo widen its growth rate while preserving a mid-teen EBIT margin?
- Does Kansai’s PAT decline prove temporary, and does the EBIT-to-PAT bridge normalise?
Those questions are more useful than simply asking which paint company has the strongest brand. Four companies entered the same financial year selling broadly similar products. Their accounts came out with four distinct fingerprints. That is where serious comparison begins.
Public sources
- Asian Paints consolidated FY26 NSE filing
- Berger Paints consolidated FY26 NSE filing
- Indigo Paints consolidated FY26 NSE filing
- Kansai Nerolac annual report 2025-26
Related reading:
Frequently asked questions
How should investors compare paint companies?
Compare at least three things together: top-line growth, operating margin and cash conversion. Similar revenue growth can conceal large differences in how much operating profit and cash each company produces.
What does EBIT margin show for a paint company?
EBIT margin shows how much operating profit remains from each ₹100 of total income before interest and tax. It reflects the combined effect of pricing, product mix, input costs, scale and operating expenses.
Why can CFO divided by EBITDA be above one?
Working capital can release cash during the year. Lower inventory, faster collections or slower supplier payments can temporarily make operating cash flow exceed EBITDA.
Does the highest CFO-to-PAT ratio mean the best cash economics?
Not necessarily. A fall in PAT can make the ratio look unusually high because the denominator shrank. CFO-to-EBITDA and multi-year free cash flow provide important second checks.