Same Score, Different Stock: What Factor Ratings Can Hide
Two stocks can reach the same composite score through opposite strengths. Read value, quality and trend separately before trusting the total.

Two stocks can receive the same composite factor score while having opposite strengths and risks. The total is useful for sorting, but the component profile explains what the score actually means.
Consider three fictional companies under a simple equal-weight illustration:
| Illustrative company | Value | Quality | Momentum | Average |
|---|---|---|---|---|
| A | 90 | 35 | 55 | 60 |
| B | 40 | 85 | 55 | 60 |
| C | 60 | 60 | 60 | 60 |
All three finish at 60. None tells the same story.
Company A relies on its value signal. Company B relies on quality. Company C has no extreme component. If the investment question concerns earnings durability, valuation risk or trend reversal, the shared total does not answer it.
The example is intentionally generic. It is not an Altys product score, weighting scheme or recommendation.
A real three-signal snapshot
The same principle appears in public market data. The following snapshot uses three common inputs for three companies on 20 July 2026: trailing P/E, FY26 return on capital employed and price relative to its 200-day moving average.
| Company | FY26 ROCE | Sector-relative ROCE position | Trailing P/E | Price vs 200DMA |
|---|---|---|---|---|
| Aegis Logistics | 15.9% | 82nd percentile | 54.1x | +76.8% |
| AstraZeneca Pharma India | 31.2% | 81st percentile | 107.4x | -7.3% |
| Hindustan Copper | 39.4% | 91st percentile | 50.8x | +0.8% |
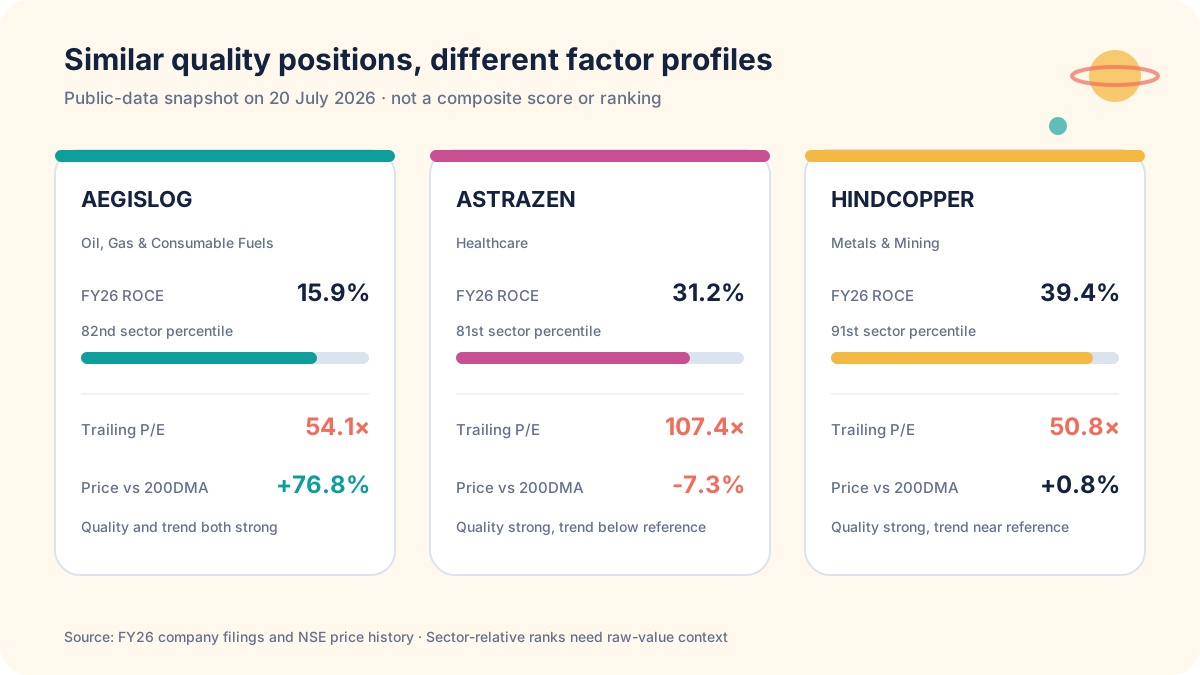
Source: Altys calculations from FY26 company filings and NSE price history through 20 July 2026. Sector position is an ascending percentile rank among companies in the same NSE sector with an available ROCE. The table is a signal comparison, not a composite score or ranking. Source links appear below.
All three sat in roughly the top fifth of their respective sectors on ROCE. A quality component based on sector-relative ROCE could therefore look similar.
The raw businesses and other signals were not similar. Aegis Logistics had the lowest ROCE of the three in absolute terms, yet its sector-relative position was comparable. Its share price was also far above its 200-day average. AstraZeneca Pharma India had the highest P/E and traded below its 200-day average. Hindustan Copper combined a high absolute ROCE with a price close to its 200-day average.
A single quality badge would compress those distinctions. A total score would compress them again.
Why sector-relative scoring helps, and where it stops
Comparing a bank’s operating margin with a manufacturer’s operating margin is usually not useful. The same problem appears inside factor models.
Sector-relative ranks help because they ask a narrower question:
How does this company compare with businesses that operate under more similar economics?
That is why a 15.9% ROCE can rank strongly in one sector while a much higher raw ROCE occupies a similar position in another.
But a percentile is not an economic unit. The 82nd percentile does not tell you how many rupees a company earns on capital, how volatile that return has been, or whether a one-time event lifted the numerator. Keep the raw value beside the rank.
Factor 1: value is a denominator problem
Value factors often use P/E, price-to-book, enterprise value to operating earnings or cash-flow yield. Each answers a different question.
P/E is especially sensitive to the earnings denominator. A demerger gain, asset sale or other exceptional item can make a stock appear unusually low on a P/E screen. A loss can make P/E unavailable altogether.
A robust value component therefore needs attribution:
- Which multiple contributed?
- Was the denominator positive and meaningful?
- Were earnings from continuing operations?
- Was the comparison made within an appropriate sector?
“High value score” is a starting label. The raw multiple and its earnings bridge are the evidence.
Factor 2: quality depends on the business model
ROCE, ROE, margins, cash conversion and balance-sheet strength are common quality inputs. They are not interchangeable.
A bank is built around financial leverage, so ROCE and ordinary operating cash flow are not directly comparable with those of an industrial company. ROE, asset quality, capital adequacy and funding economics carry more meaning. An insurer has yet another structure.
Even among non-financial companies, a high ROCE can arise from a small capital base, asset disposals or an unusually strong profit period. Useful quality analysis asks:
- Is the metric applicable to this sector?
- Is the return persistent across several years?
- Did cash generation support it?
- Did an exceptional item alter profit or capital employed?
The component earns trust when its economic source is visible.
Factor 3: momentum has a clock
Momentum can mean a one-month return, a 12-month return, distance from a moving average, earnings revisions or a blend of several horizons.
Those measures can disagree. A stock can remain above its 200-day average after a recent decline. Another can sit below the average while its shorter-term trend improves.
Every momentum reading therefore needs a date and horizon. “Strong momentum” without both is not reproducible.
The table’s price-versus-200DMA column is deliberately simple. It does not forecast the next move. It tells us only where the closing price sat relative to one trailing reference on 20 July 2026.
Missing data is not a neutral score
Aggregation becomes most dangerous when an input is unavailable.
Suppose a three-factor score has no meaningful ROCE for a bank. Replacing the missing value with zero silently penalises the bank for the accounting structure of its business. Replacing it with the average silently invents evidence. Dropping the factor changes the effective weights.
There is no universal fix, but the treatment must be explicit. A scorecard should show:
- Not applicable because of the business model.
- Not available because the source is missing or stale.
- Excluded because the denominator is not meaningful.
- Reweighted, if the remaining components now carry more weight.
A blank cell can be a correct analytical result.
The scorecard an analyst can audit
A useful factor result has three layers:
1. The total
This is the sorting layer. It helps narrow a large universe.
2. The attribution
Show how much value, quality, momentum and any other family contributed. This reveals whether the total is balanced or dependent on one extreme signal.
3. The evidence
Show the raw ratio, sector position, period, price date and reason for any missing value. This is where an analyst can challenge the result.
The total should never be more precise than the evidence beneath it.
A better way to use factor scores
Factor scores are most useful as maps, not verdicts. They can identify unusual combinations, surface disagreements and decide which filings deserve attention first.
The best follow-up question is not “Which company scored highest?” It is:
What combination of value, quality and trend produced this result, and would I reach the same interpretation from the raw evidence?
If that answer is visible, the score accelerates research. If it is hidden, a tidy number can conceal the most important part of the story.
Public sources
- Aegis Logistics consolidated FY26 NSE filing
- AstraZeneca Pharma India standalone FY26 NSE filing
- Hindustan Copper consolidated FY26 NSE filing
- NSE security-wise price and volume archives
Related reading:
Frequently asked questions
Can two stocks with the same factor score be very different?
Yes. One may combine a low valuation with weak quality, while another combines strong quality with a demanding valuation. Aggregation can produce the same total from opposite component profiles.
Which factors should a stock score include?
There is no universal set. Common families include value, quality, growth, momentum, risk and revisions. The important questions are what each input measures, whether it suits the sector, how fresh it is and how missing values are handled.
Should factor scores be compared across sectors?
Only with care. Capital structures and meaningful ratios differ across banks, manufacturers, commodity businesses and insurers. Sector-relative ranks can improve comparability, but they do not remove business-model differences.
What should I inspect besides the final factor score?
Inspect component scores, raw values, sector ranks, data dates, missing inputs and the reason for any unusual earnings or price signal. A score without attribution is difficult to audit.