When Profit Outruns Sales: Four Checks Before You Celebrate
Profit growing faster than sales can signal better economics or a temporary lift. Check the top line, margin bridge, cash and comparison base.

Profit growing faster than sales is encouraging only when the improvement comes from durable business economics. Before celebrating, check whether the top line grew, what changed in margins, whether profit arrived as cash, and whether the prior year was a normal comparison base.
A company can grow profit faster than its top line for several reasons. Some are durable: better product mix, stronger pricing, higher utilisation or structural cost advantages. Others are temporary: a weak comparison year, lower input costs, tax movements, exceptional items or a release of working capital.
The useful question is not simply, “How fast did profit grow?” It is:
What had to change inside the business for profit to grow at that speed, and can it happen again?
A five-company FY26 snapshot
The table deliberately mixes sectors. It is not a peer ranking. It shows why the same headline, profit growth, can describe very different operating stories.
| Company | Total-income growth | PAT growth | Net margin | CFO / PAT |
|---|---|---|---|---|
| Asian Paints | 5.3% | 17.9% | 11.9% | 1.64x |
| Britannia Industries | 6.6% | 16.3% | 13.1% | 1.03x |
| Marico | 25.1% | 8.2% | 12.8% | 1.18x |
| Nestlé India | 14.5% | 38.0% | 15.1% | 1.44x |
| TCS | 4.7% | 1.4% | 18.1% | 1.06x |
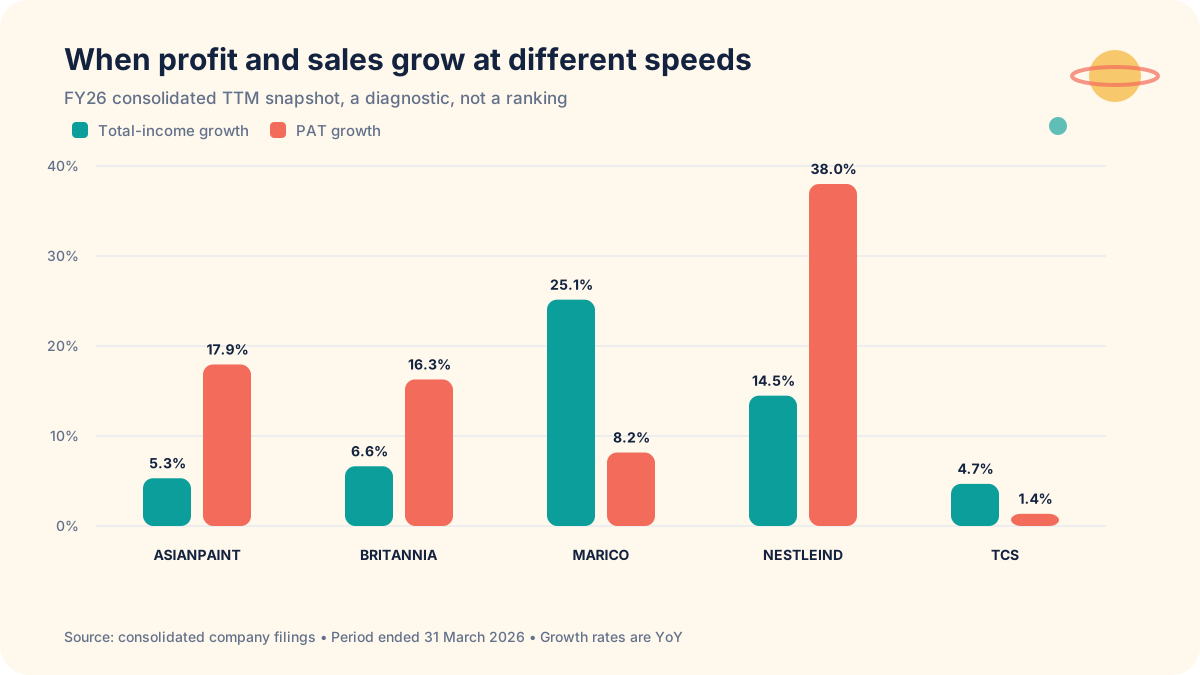
Source: Altys calculations from the companies’ consolidated FY25 and FY26 results, filed with NSE or published through company investor relations. Period ended 31 March 2026; calculations dated 10 August 2026. Source links appear below.
Here, “sales” is shorthand for the top line. Total income is used for the common comparison because it is available on the same consolidated basis across the five companies.
Three companies show PAT growing much faster than total income. Marico shows the opposite: a very strong top-line year with slower profit growth. TCS sits in a third pattern, where both moved modestly and profit lagged.
None of those patterns is automatically good or bad. Each tells us where to look next.
Check 1: Did the business grow, or did only profit grow?
Start with the top line because it tells you whether the company had more economic activity to work with.
Nestlé India’s total income grew 14.5% while PAT grew 38.0%. Asian Paints reported 5.3% growth in total income and 17.9% growth in PAT. In both cases, earnings expanded faster than the base from which they were earned.
That can be powerful when it reflects operating leverage. A company adds revenue without adding costs at the same rate. The same pattern can also appear when the comparison period was unusually weak.
Marico shows the reverse. Total income grew 25.1%, but PAT rose 8.2%. The business became larger, yet each rupee of income translated into less profit than in the previous year. That does not cancel the growth. It changes the question from “Where did the growth come from?” to “What absorbed it?”
The first check is simple:
- Top line up, profit up faster: investigate margin expansion and the base.
- Top line up, profit up slower: investigate cost, mix and reinvestment.
- Profit up, top line flat or down: demand a particularly strong explanation.
Check 2: Follow the margin bridge
When PAT grows faster than total income, net margin usually expands if the periods and accounting basis are comparable.
| Company | Approx. FY25 net margin | FY26 net margin | Change |
|---|---|---|---|
| Asian Paints | 10.6% | 11.9% | +1.3 percentage points |
| Britannia Industries | 12.0% | 13.1% | +1.1 percentage points |
| Marico | 14.8% | 12.8% | -2.0 percentage points |
| Nestlé India | 12.5% | 15.1% | +2.6 percentage points |
| TCS | 18.7% | 18.1% | -0.6 percentage points |
Source: calculated from the same consolidated FY25 and FY26 filings listed below, as of 10 August 2026.
That narrows the investigation, but it does not finish it.
A higher net margin can come from operations, lower finance cost, other income, tax or an exceptional item. Those sources do not have the same value. A repeatable improvement in operating economics deserves more confidence than a one-year below-the-line benefit.
The next document to open is the profit bridge, not the price chart.
Check 3: Did the accounting profit arrive as cash?
Profit is measured under accrual accounting. Cash from operations records what moved through the business after working-capital effects.
For FY26, operating cash flow exceeded PAT for all five companies in the sample. CFO/PAT ranged from 1.03 times at Britannia to 1.64 times at Asian Paints, based on the consolidated cash-flow and income statements for the year ended 31 March 2026.
That is encouraging, but the ratio needs restraint.
A figure above one does not mean every rupee of profit is permanently superior. Inventory reductions, faster collections, slower supplier payments and tax timing can lift one year’s operating cash flow. Equally, a sound growing business can report a temporarily low ratio while it builds inventory or extends credit.
Use CFO/PAT as a question generator:
- Is the ratio above one because earnings are genuinely cash-rich?
- Did working capital release cash that cannot be released twice?
- Does the result persist over three to five years?
- Is capital expenditure consuming most of the cash after it is generated?
One year of good cash conversion is evidence. A repeated pattern is a trait.
Check 4: Separate a durable change from a helpful comparison
Growth rates describe the distance from last year’s base. They do not tell you whether that base was normal.
Suppose profit falls from ₹100 to ₹60 and then rebounds to ₹84. The second year records 40% growth, yet profit remains 16% below where it began. The growth rate is correct. The recovery story is incomplete.
This is why a strong annual number should be placed beside:
- The previous three to five years of absolute PAT.
- The corresponding margin history.
- The company’s operating cash flow and capital expenditure.
- The original cause of the weak or strong base.
The more cyclical the business, the more important this becomes.
A better way to read the headline
“PAT grew 38%” is a fact.
“The business improved because PAT grew 38%” is a hypothesis.
The hypothesis earns confidence only after the top line, margin bridge, cash conversion and comparison base agree with it. A striking number should not make the analysis shorter. It should tell you where to begin.
Public sources
- Asian Paints consolidated FY26 NSE filing
- Britannia Industries consolidated FY26 NSE filing
- Marico consolidated FY26 results
- Nestlé India consolidated FY26 NSE filing
- TCS consolidated FY26 NSE filing
Related reading:
Frequently asked questions
Is profit growing faster than sales always a good sign?
No. It can reflect operating leverage and better margins, but it can also come from a weak comparison year, lower tax, exceptional items or a temporary cost benefit. The cause and its repeatability matter more than the headline rate.
What should I check when PAT growth is higher than revenue growth?
Check whether the top line grew, where margins changed, whether operating cash flow kept pace with profit, and whether the prior year was a normal base. Those four checks separate durable improvement from a flattering comparison.
Why compare operating cash flow with PAT?
PAT is measured under accrual accounting, while operating cash flow shows what moved through the business after working-capital effects. The comparison helps reveal whether reported profit was supported by cash.
Does a CFO-to-PAT ratio above one prove high earnings quality?
Not by itself. Inventory reductions, faster collections, supplier timing and taxes can lift one year's cash flow. A repeated multi-year pattern is more useful than a single reading.