How to use Altys
Altys is a research terminal for Indian equities and funds. This guide walks through five ways to use it, from building a strategy to reading the macro tape. Each one is a short loop you can run end to end, with a screenshot of every step.
Signing in and the home terminal
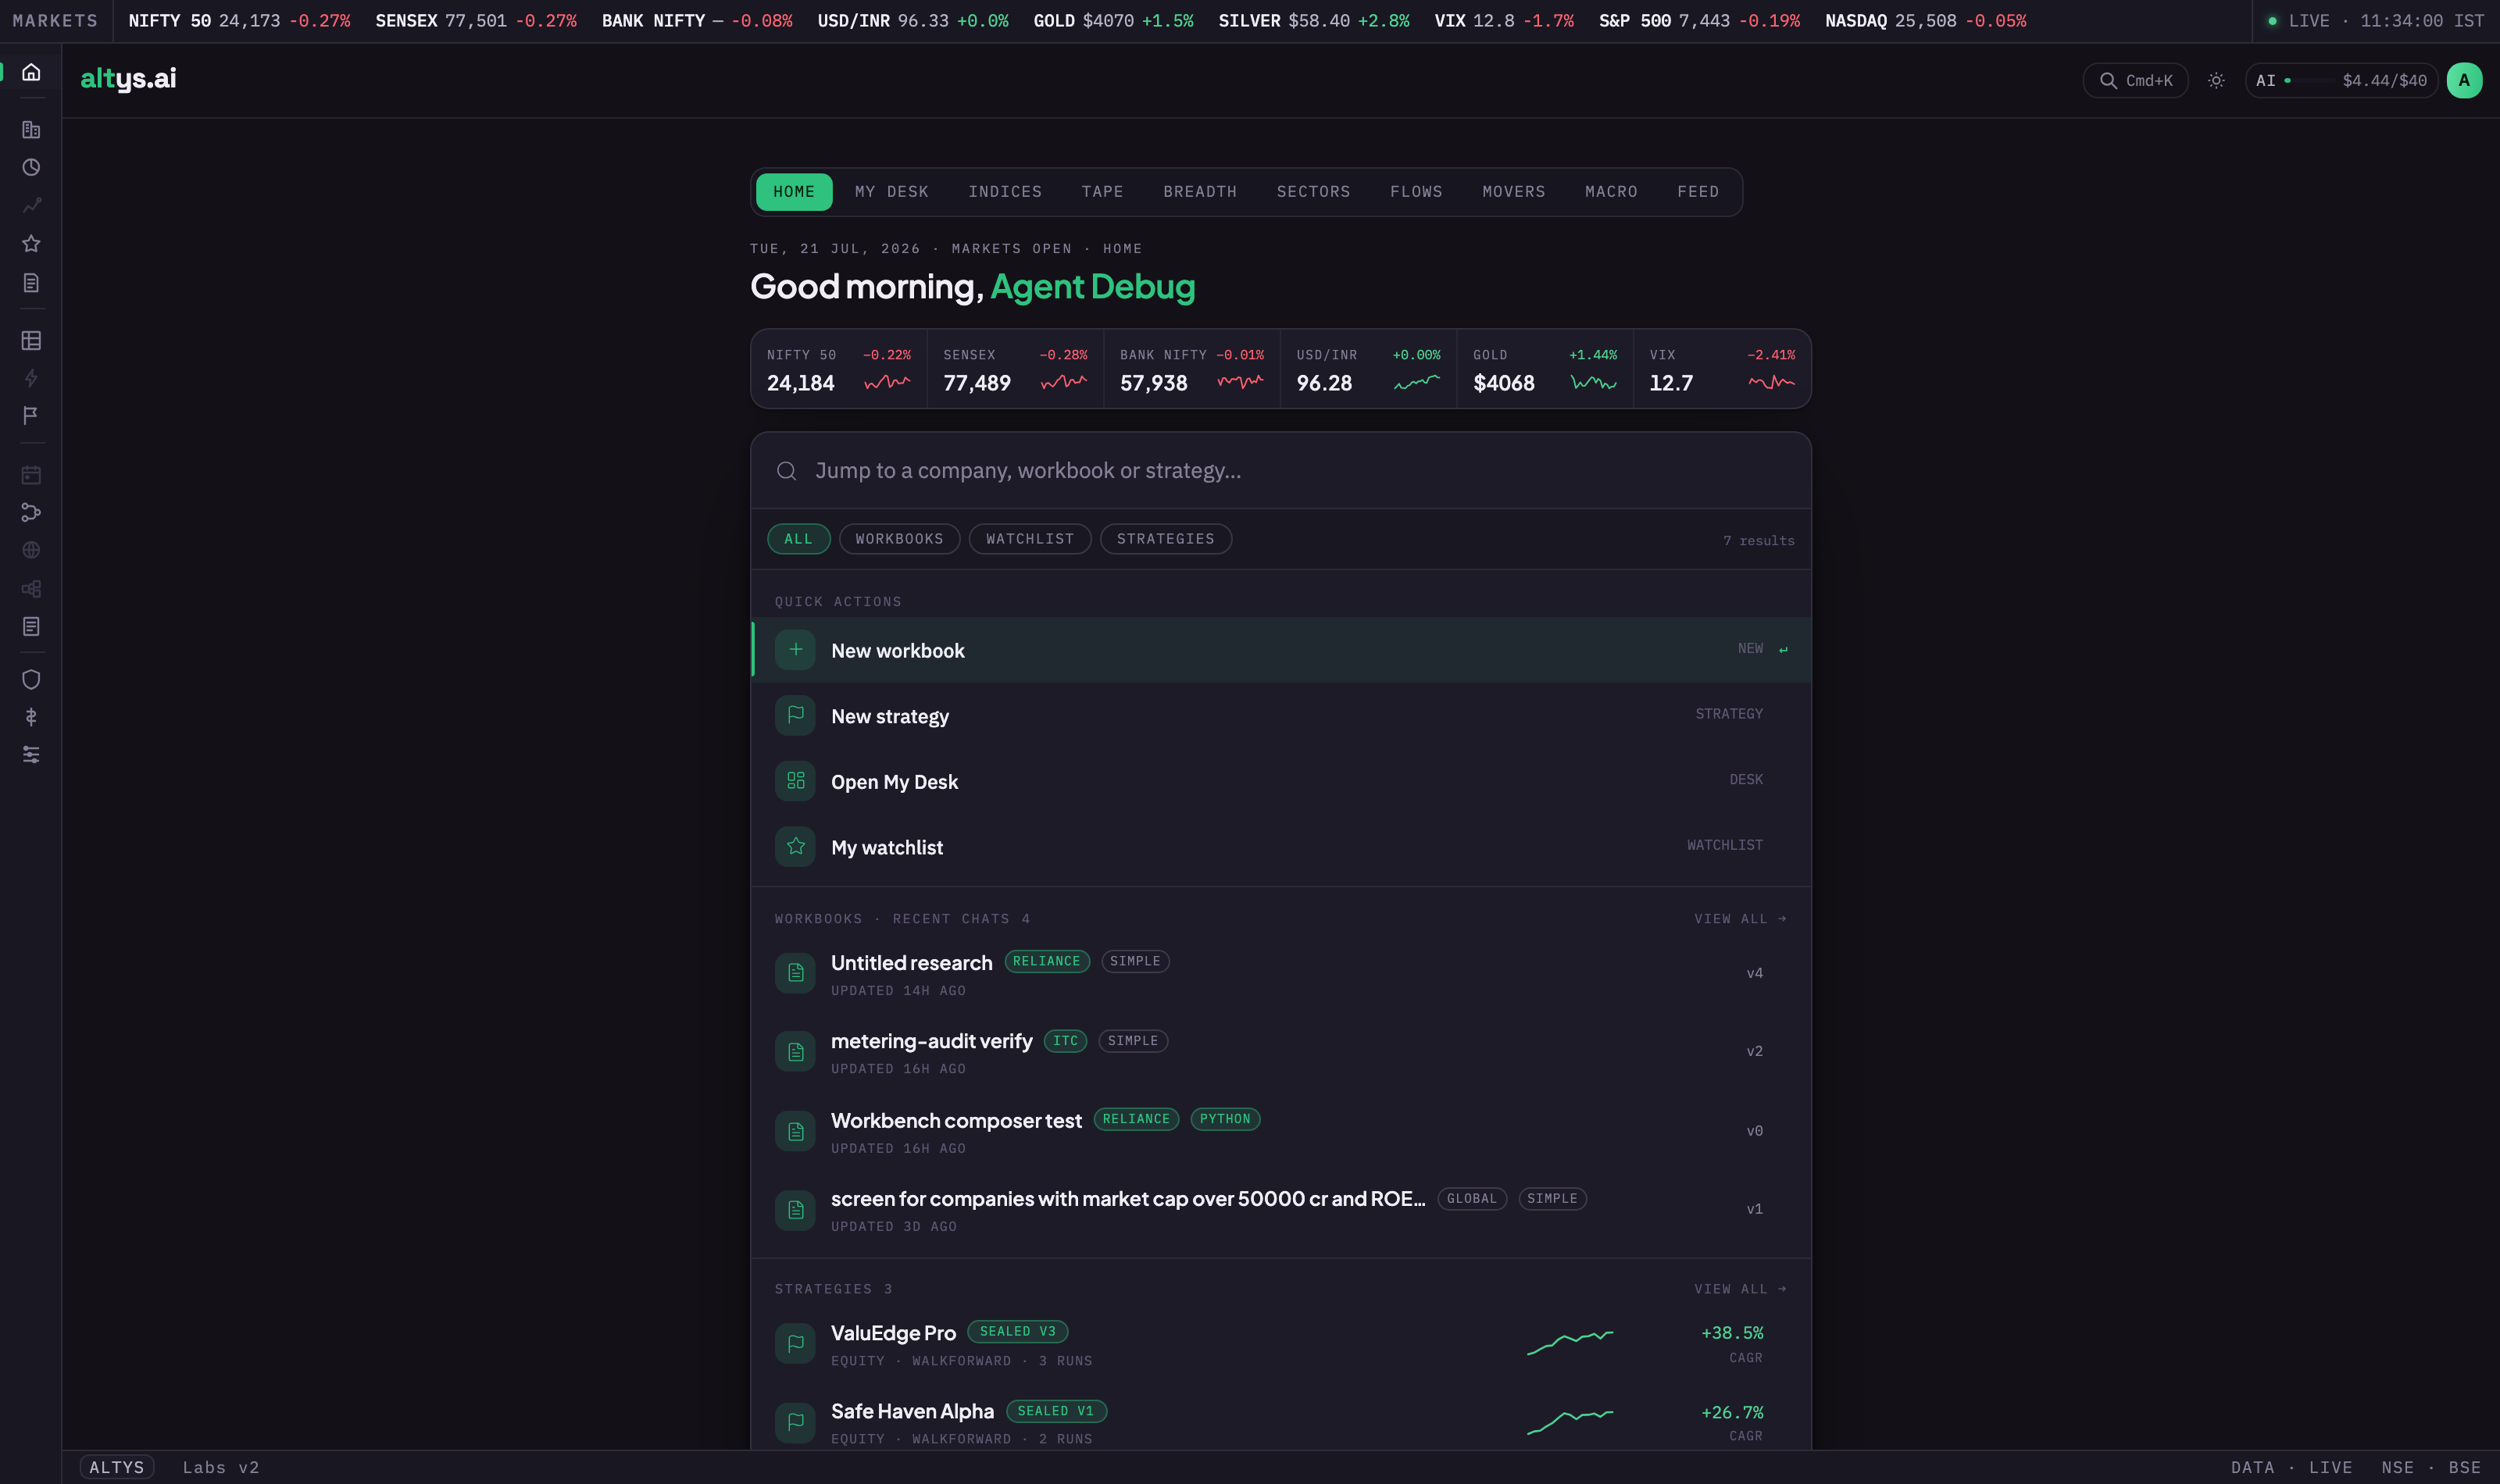
Sign in with the email and password from your invite at console.altys.io. You land on the Terminal, the home screen. The top strip is the live market tape, the row of tabs (Home, My Desk, Indices, Tape, Breadth, Sectors, Flows, Movers, Macro, Feed) switches the dashboard, and the search box in the middle is the same one you get from Cmd K anywhere in the app.
Build a strategy, then act on the names it finds
A strategy in Altys is a rule: which companies are eligible, how they are ranked, and how the basket is held and rebalanced. You define it, backtest it against point-in-time data, and once you are satisfied you carry the resulting names into a grid and your watchlist.
Open the strategy library
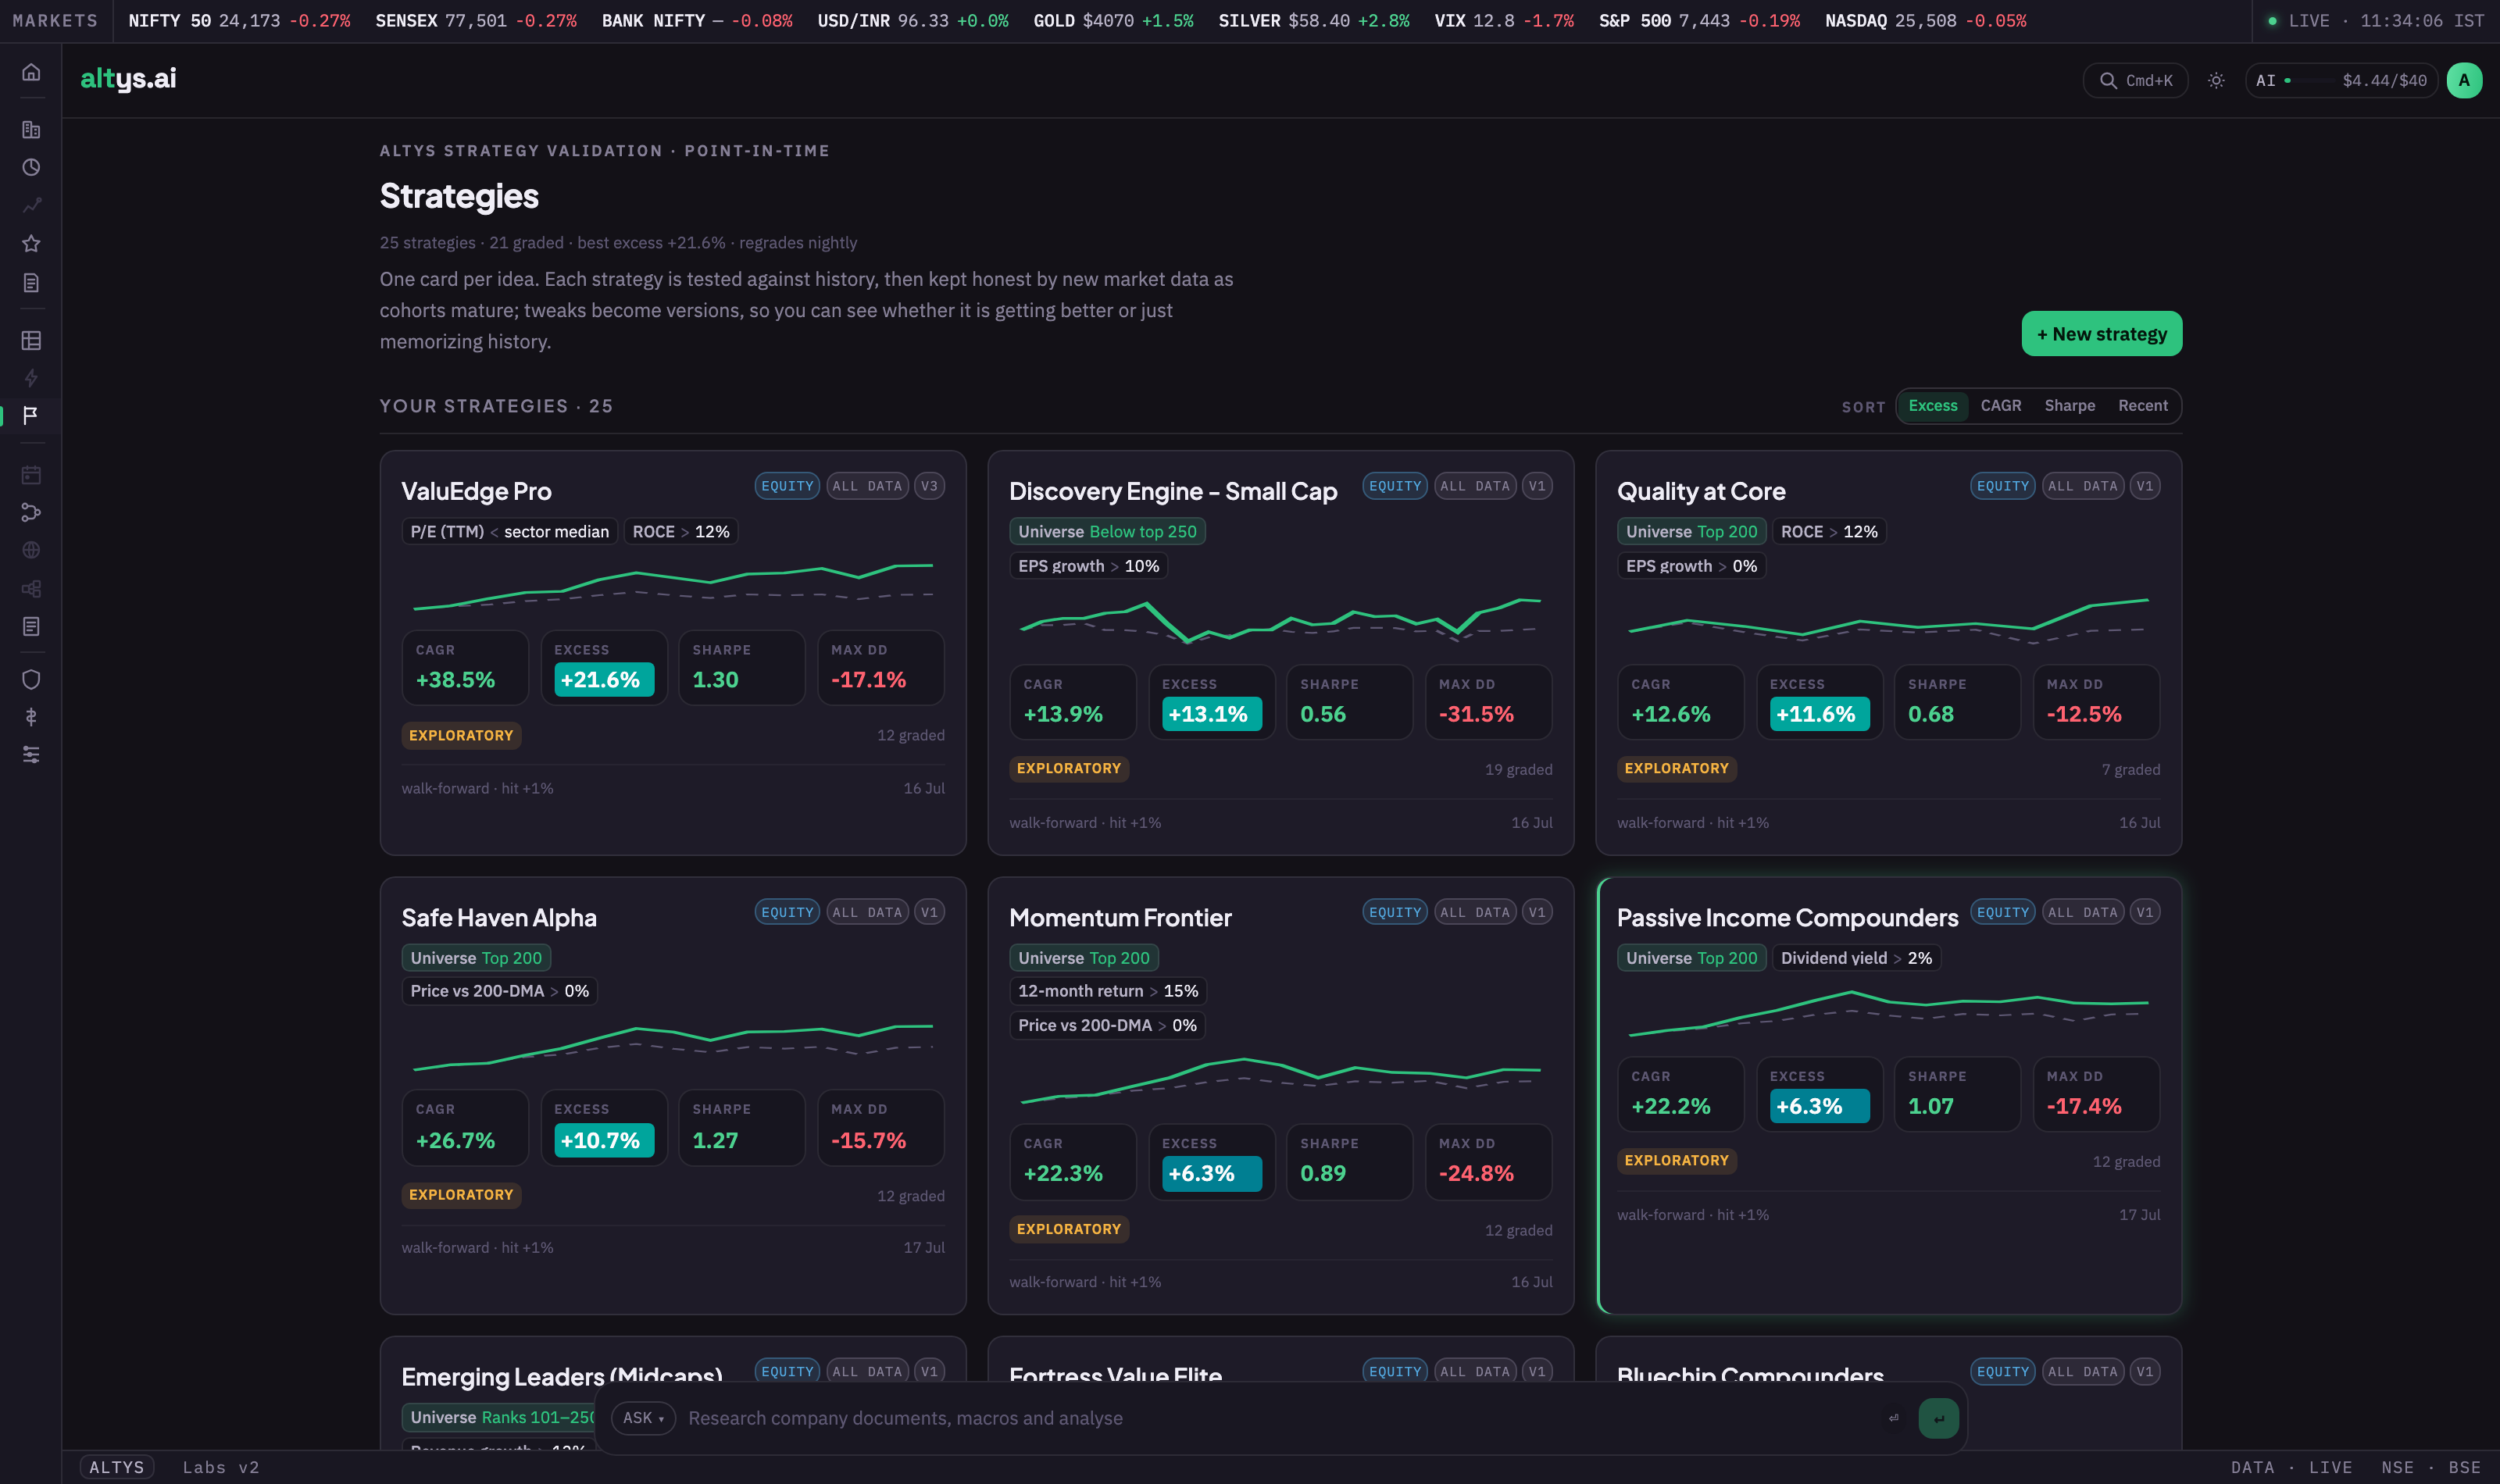
Go to Strategies from the left rail. The library lists every strategy you have built, each with its grade and best excess return. Open one to keep working, or start a fresh one.
Define the rule
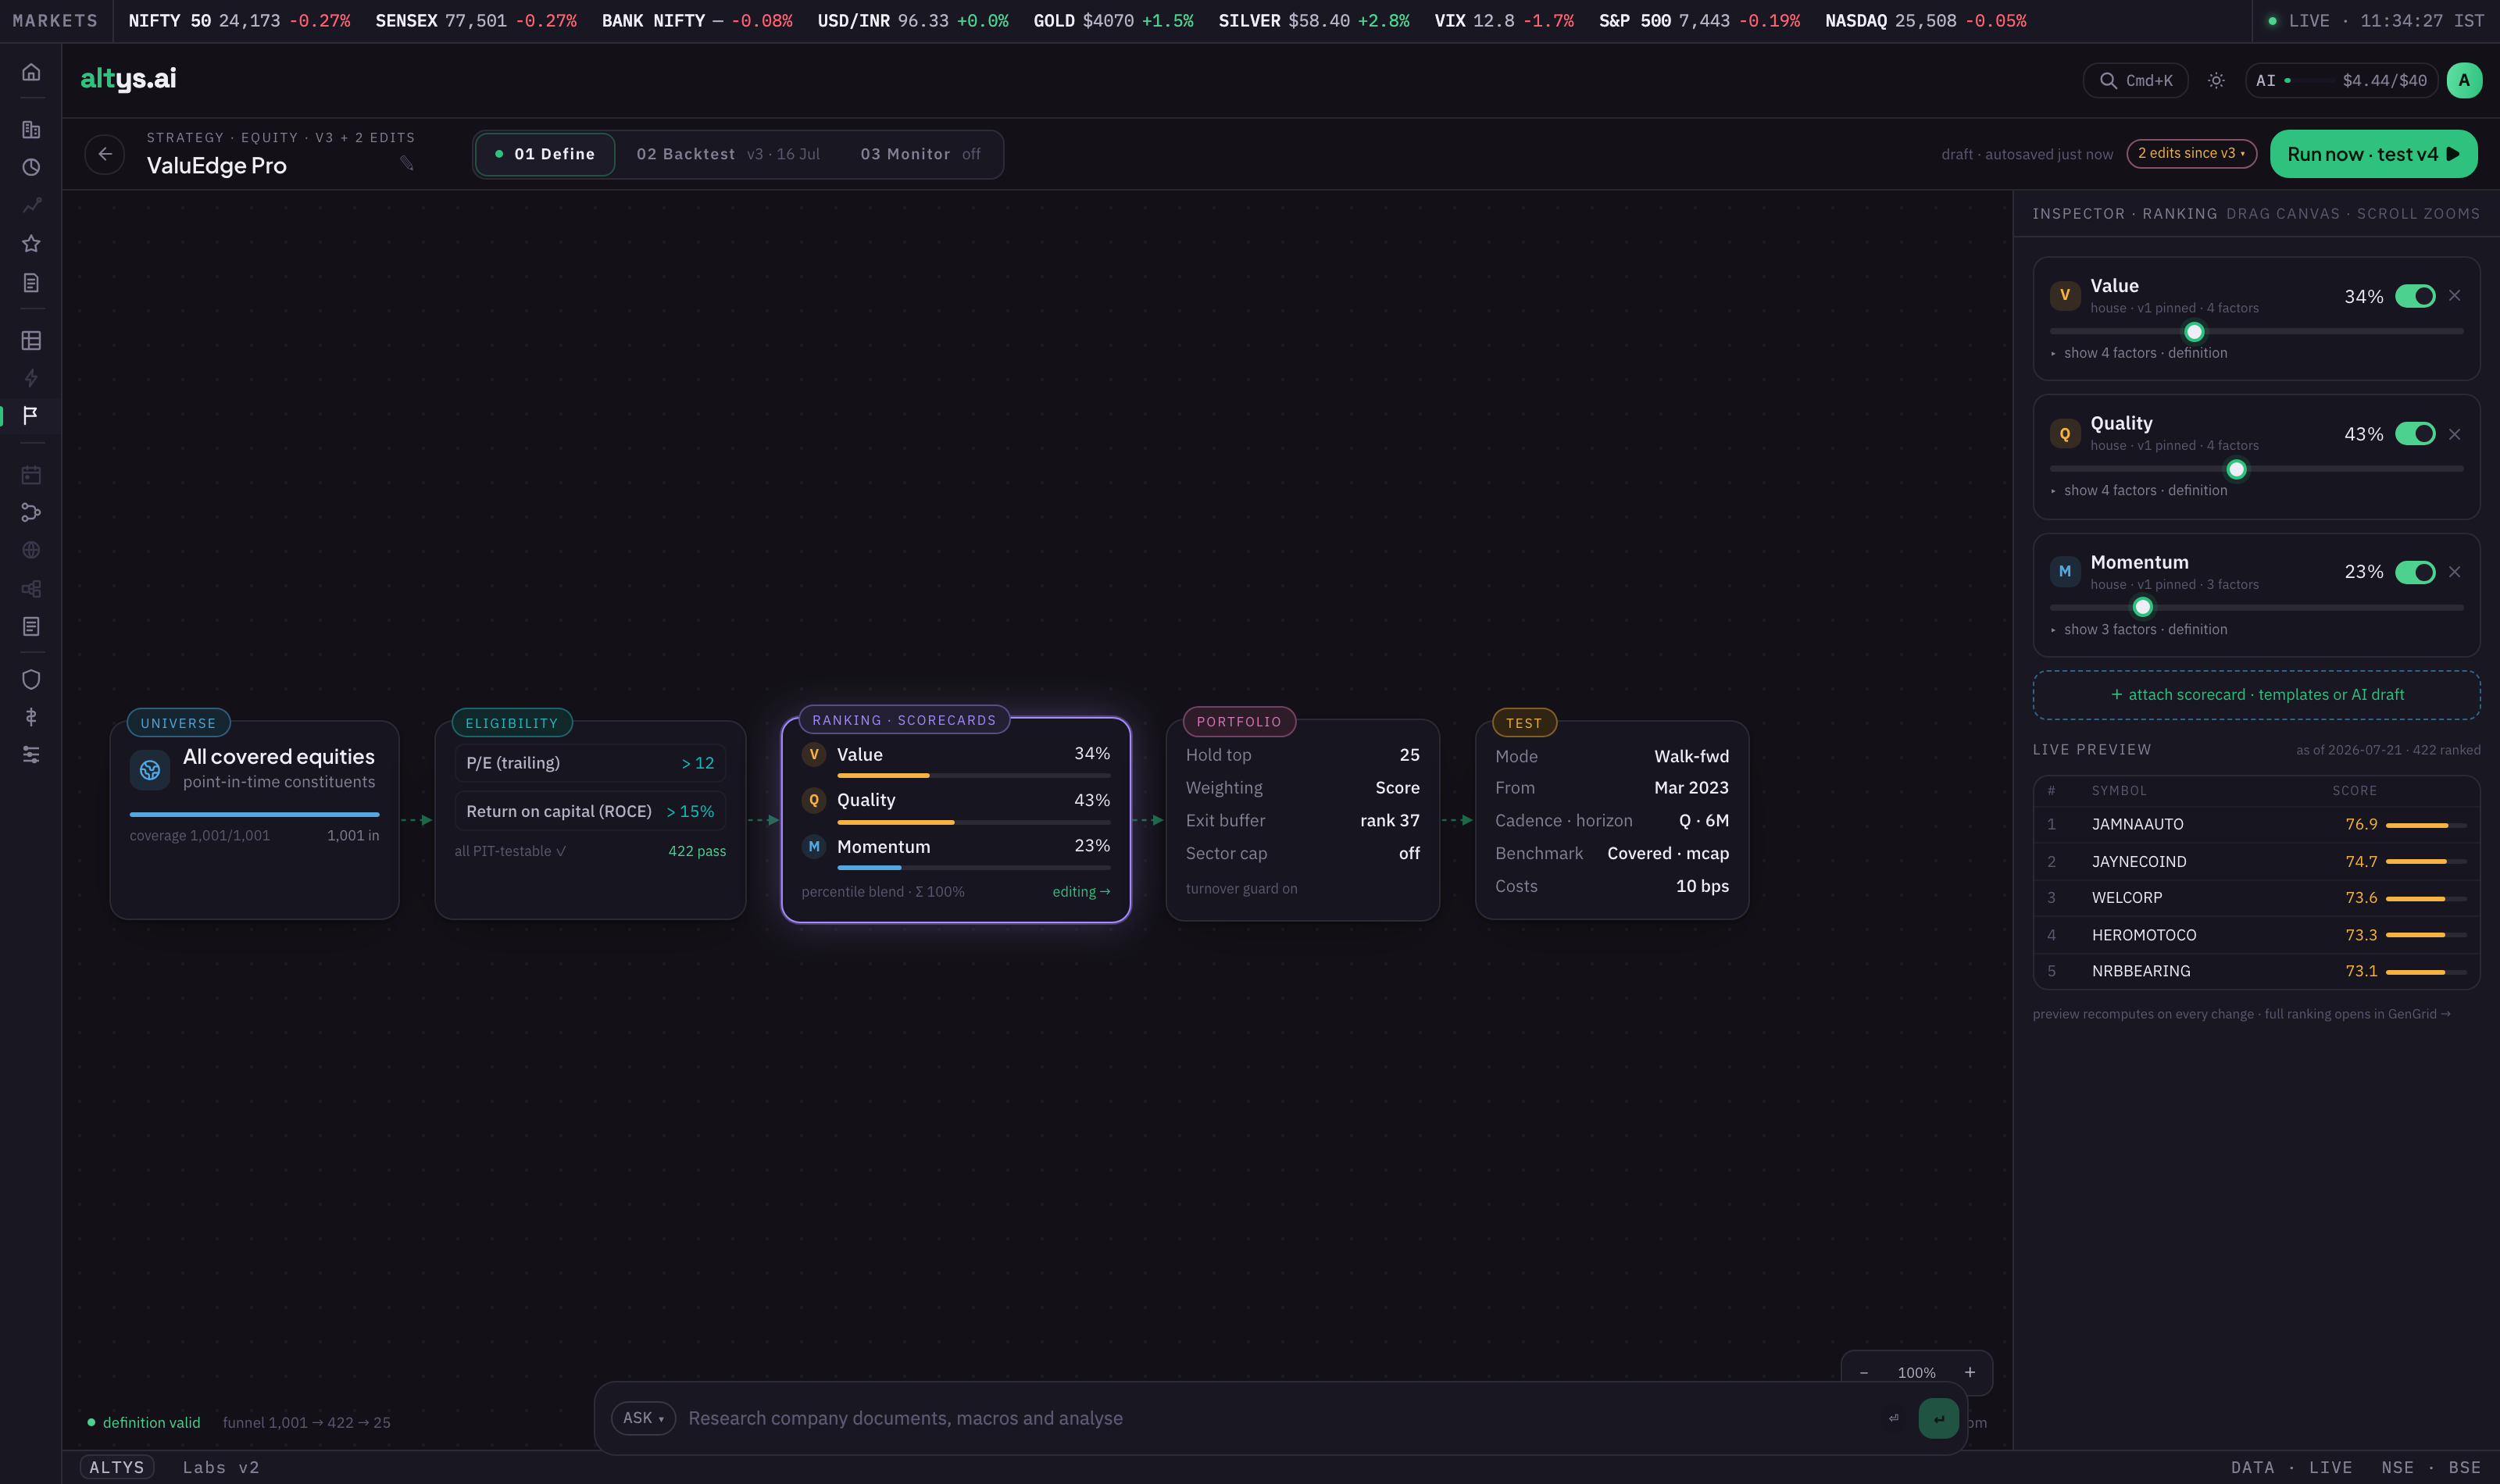
The workspace runs left to right in three stages: Define, Backtest, Monitor. In Define you set the universe, add eligibility gates (for example P/E below 12 and return on capital above 15 percent), and blend ranking scorecards like Value, Quality, and Momentum. The funnel at the bottom shows how many names survive each gate, and the live preview on the right ranks them as you tune.
Backtest and read the evidence
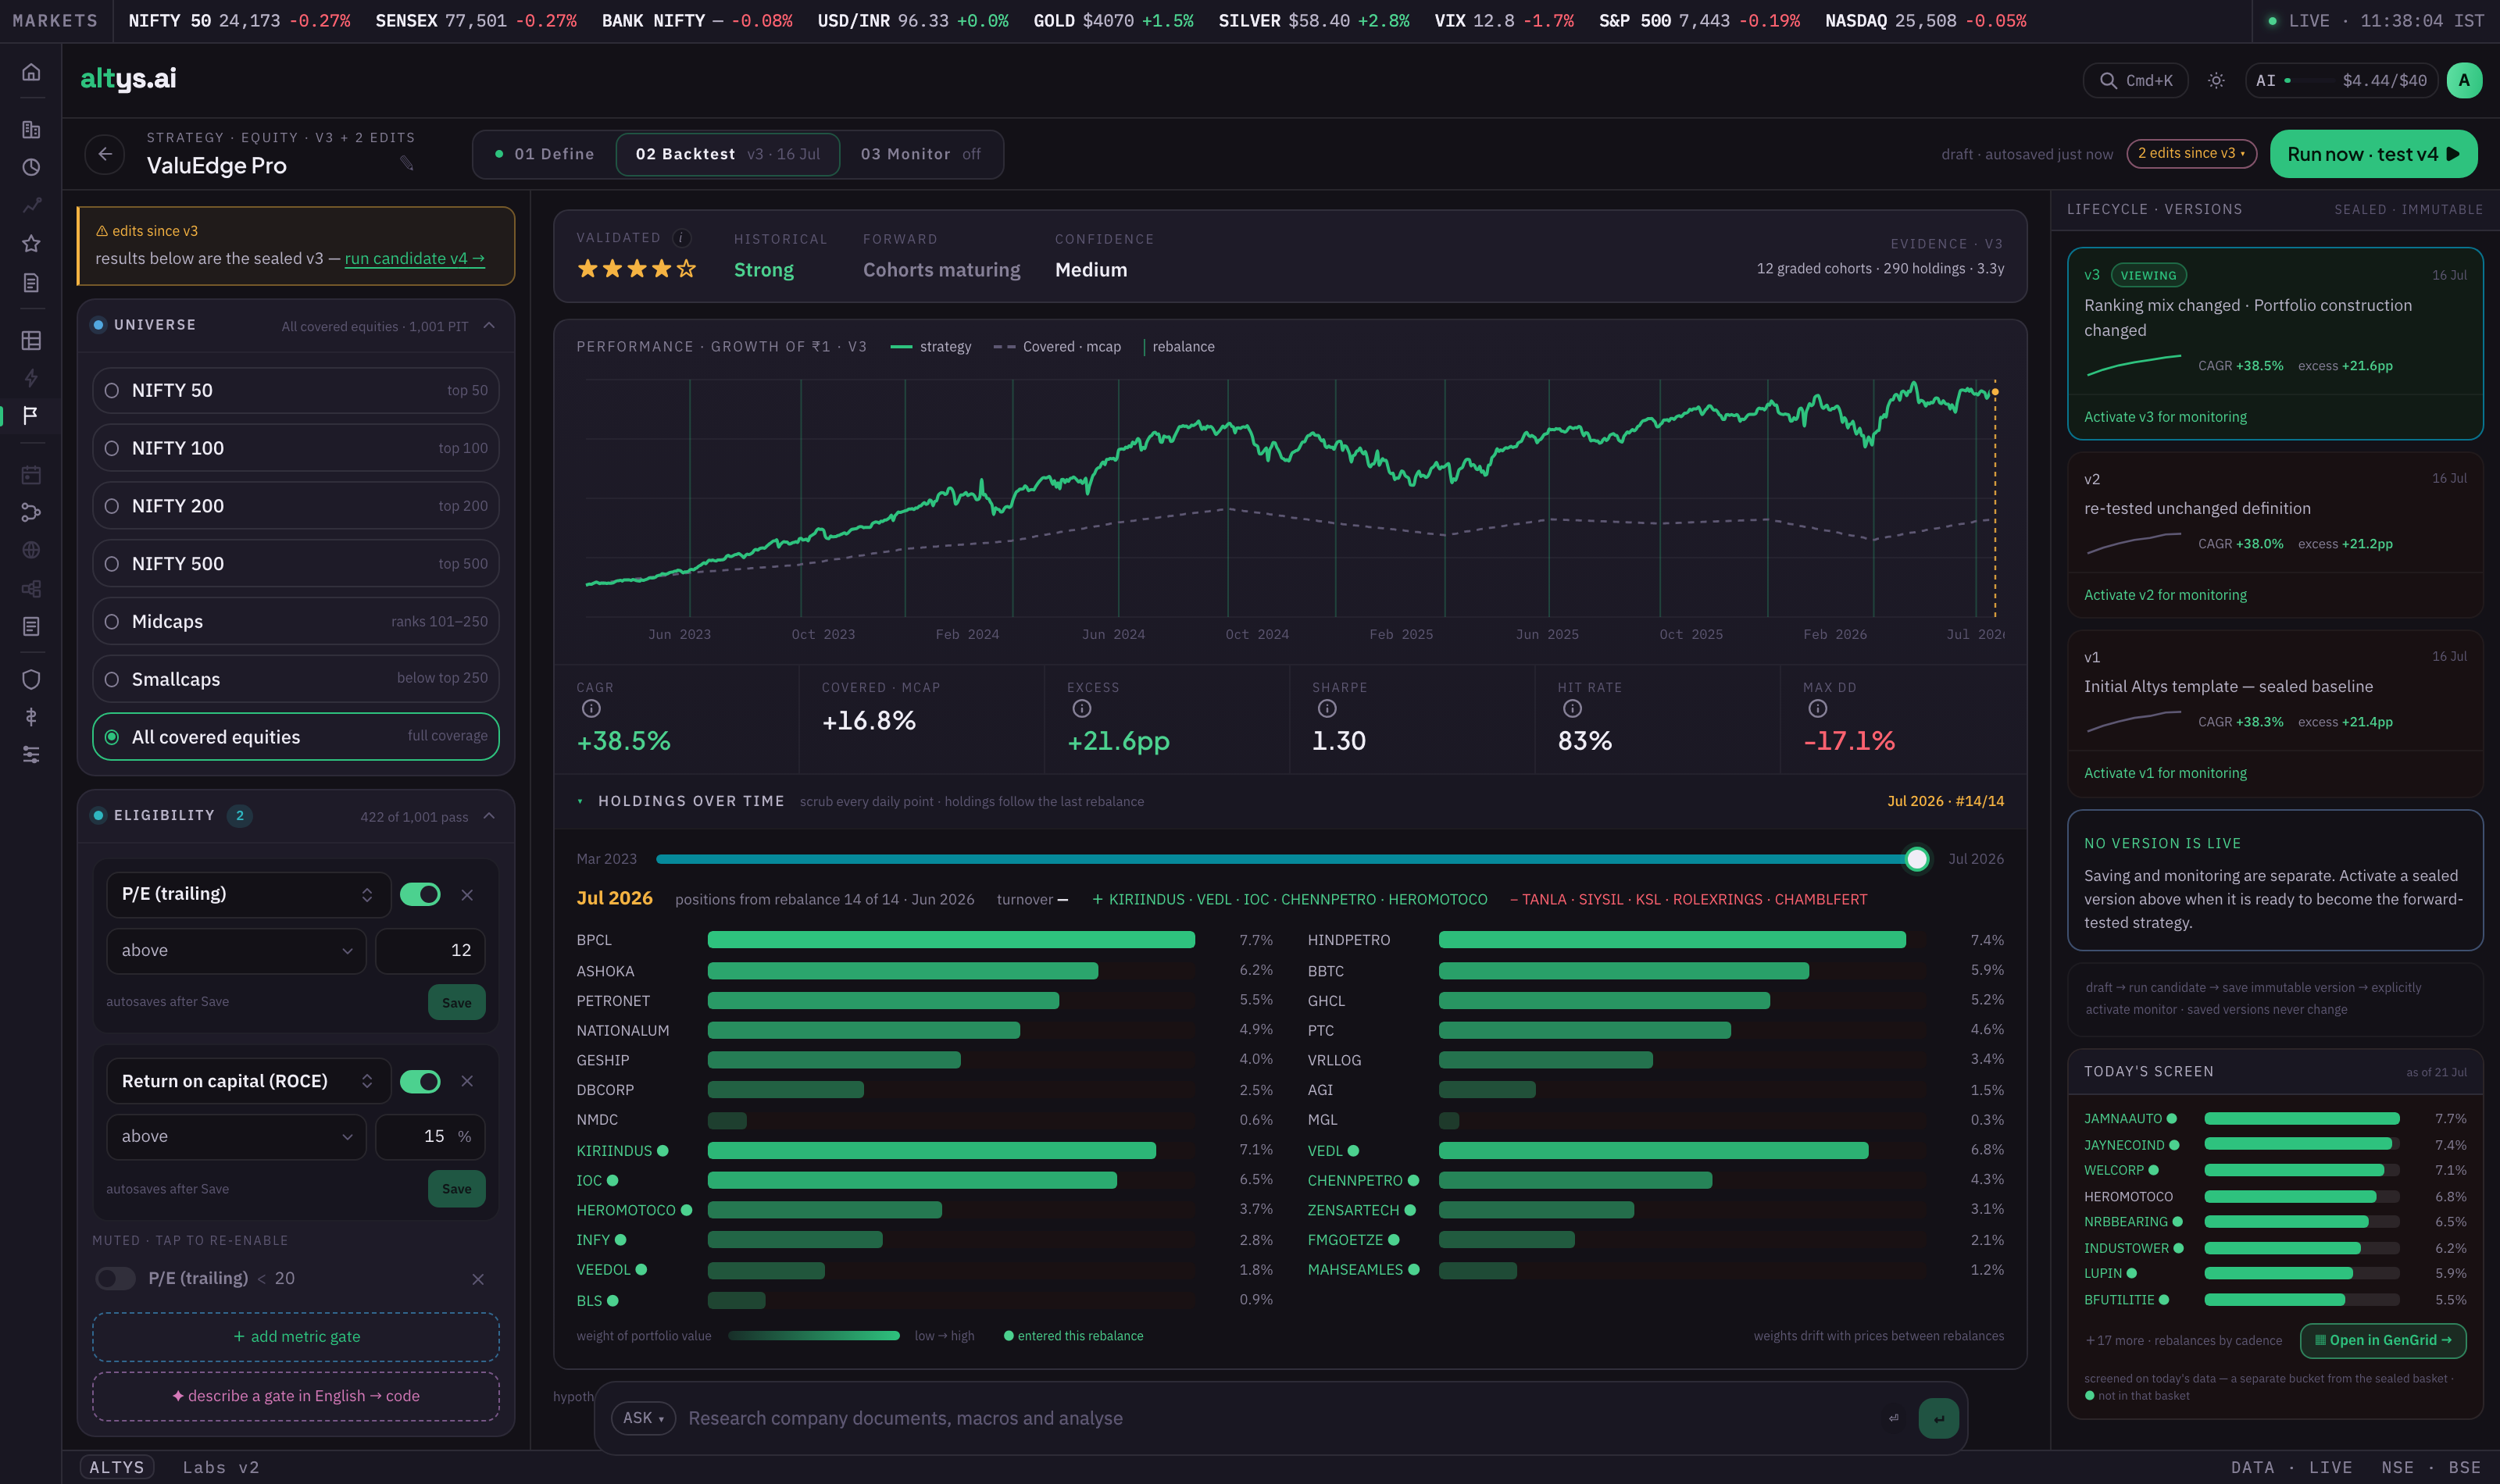
Run the strategy and move to the Backtest stage. You get a growth-of-one-rupee curve against a benchmark, headline stats (CAGR, excess return, Sharpe, hit rate, max drawdown), and the actual holdings at every rebalance so you can see what it would have owned and when. Each saved version is immutable, so you can compare a candidate against the sealed baseline.
Take the basket into a grid
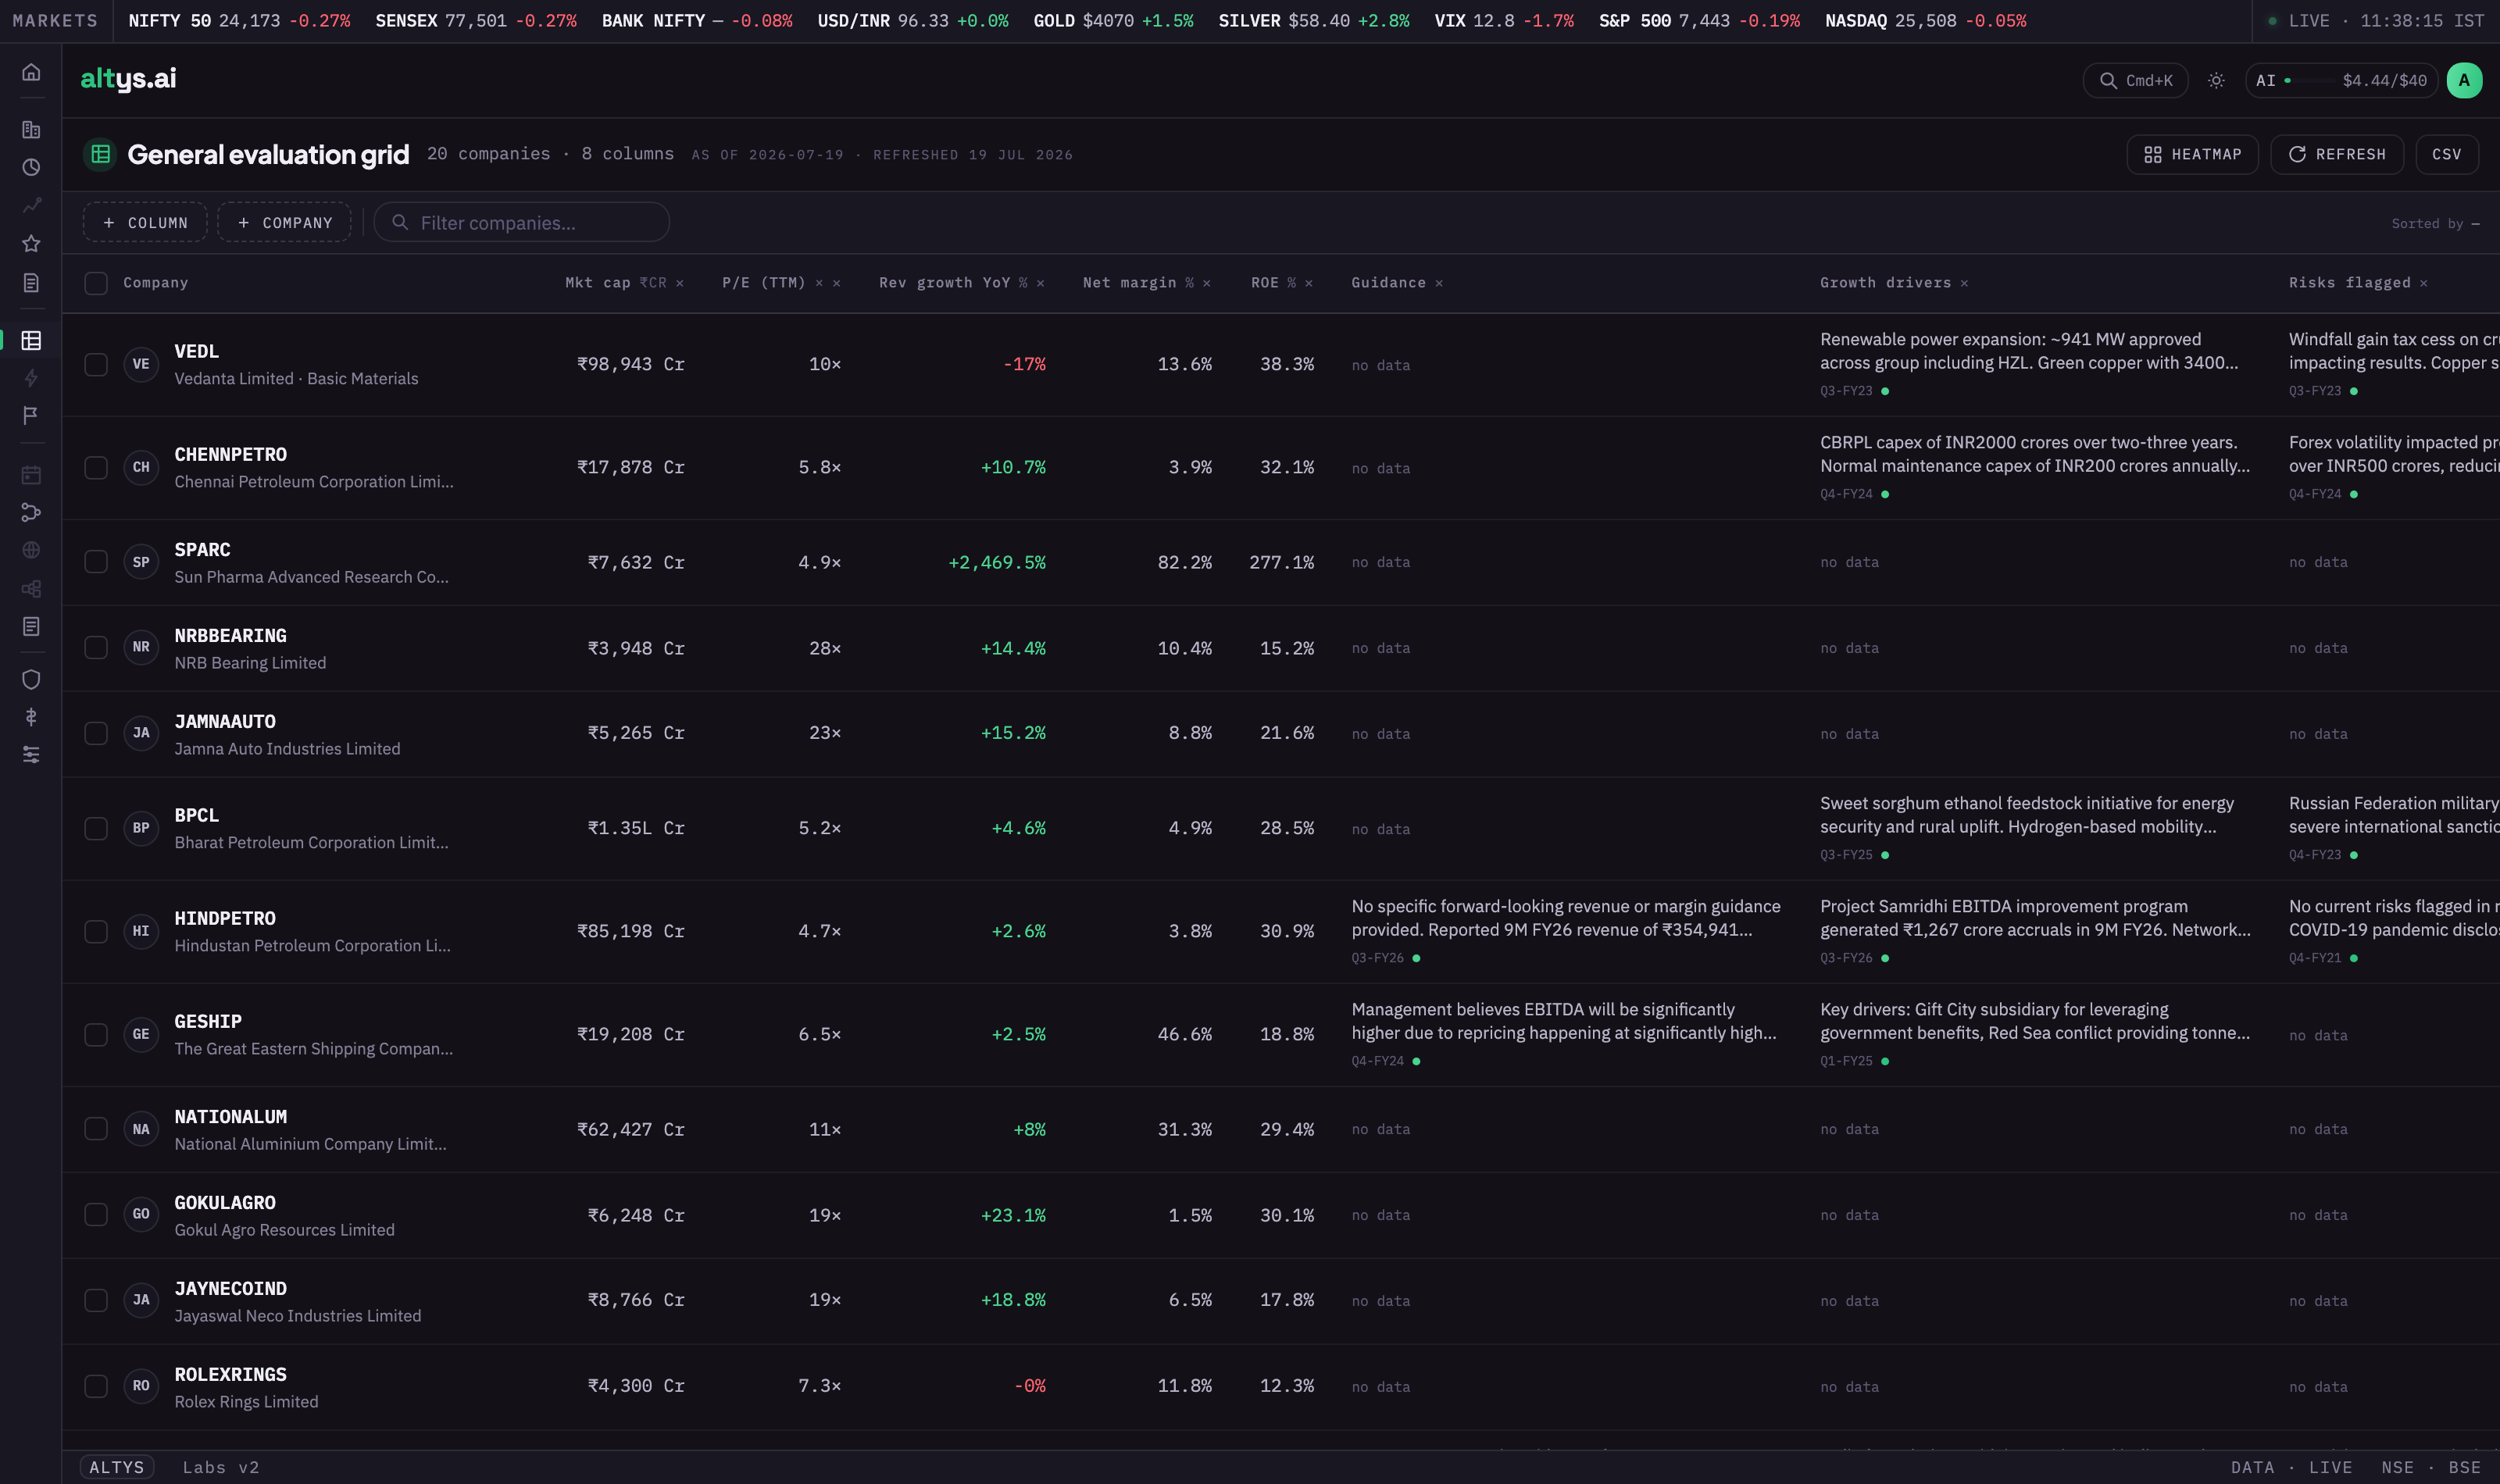
When a strategy looks right, open its holdings in GenGrid from the strategy or from the Grids surface. A grid puts your companies down the rows and the metrics you care about across the columns (market cap, P/E, revenue growth, margins, return on equity, guidance, growth drivers, flagged risks). It refreshes nightly as new filings land, and you can sort, add columns, or switch to a heatmap.
Move names through your watchlist
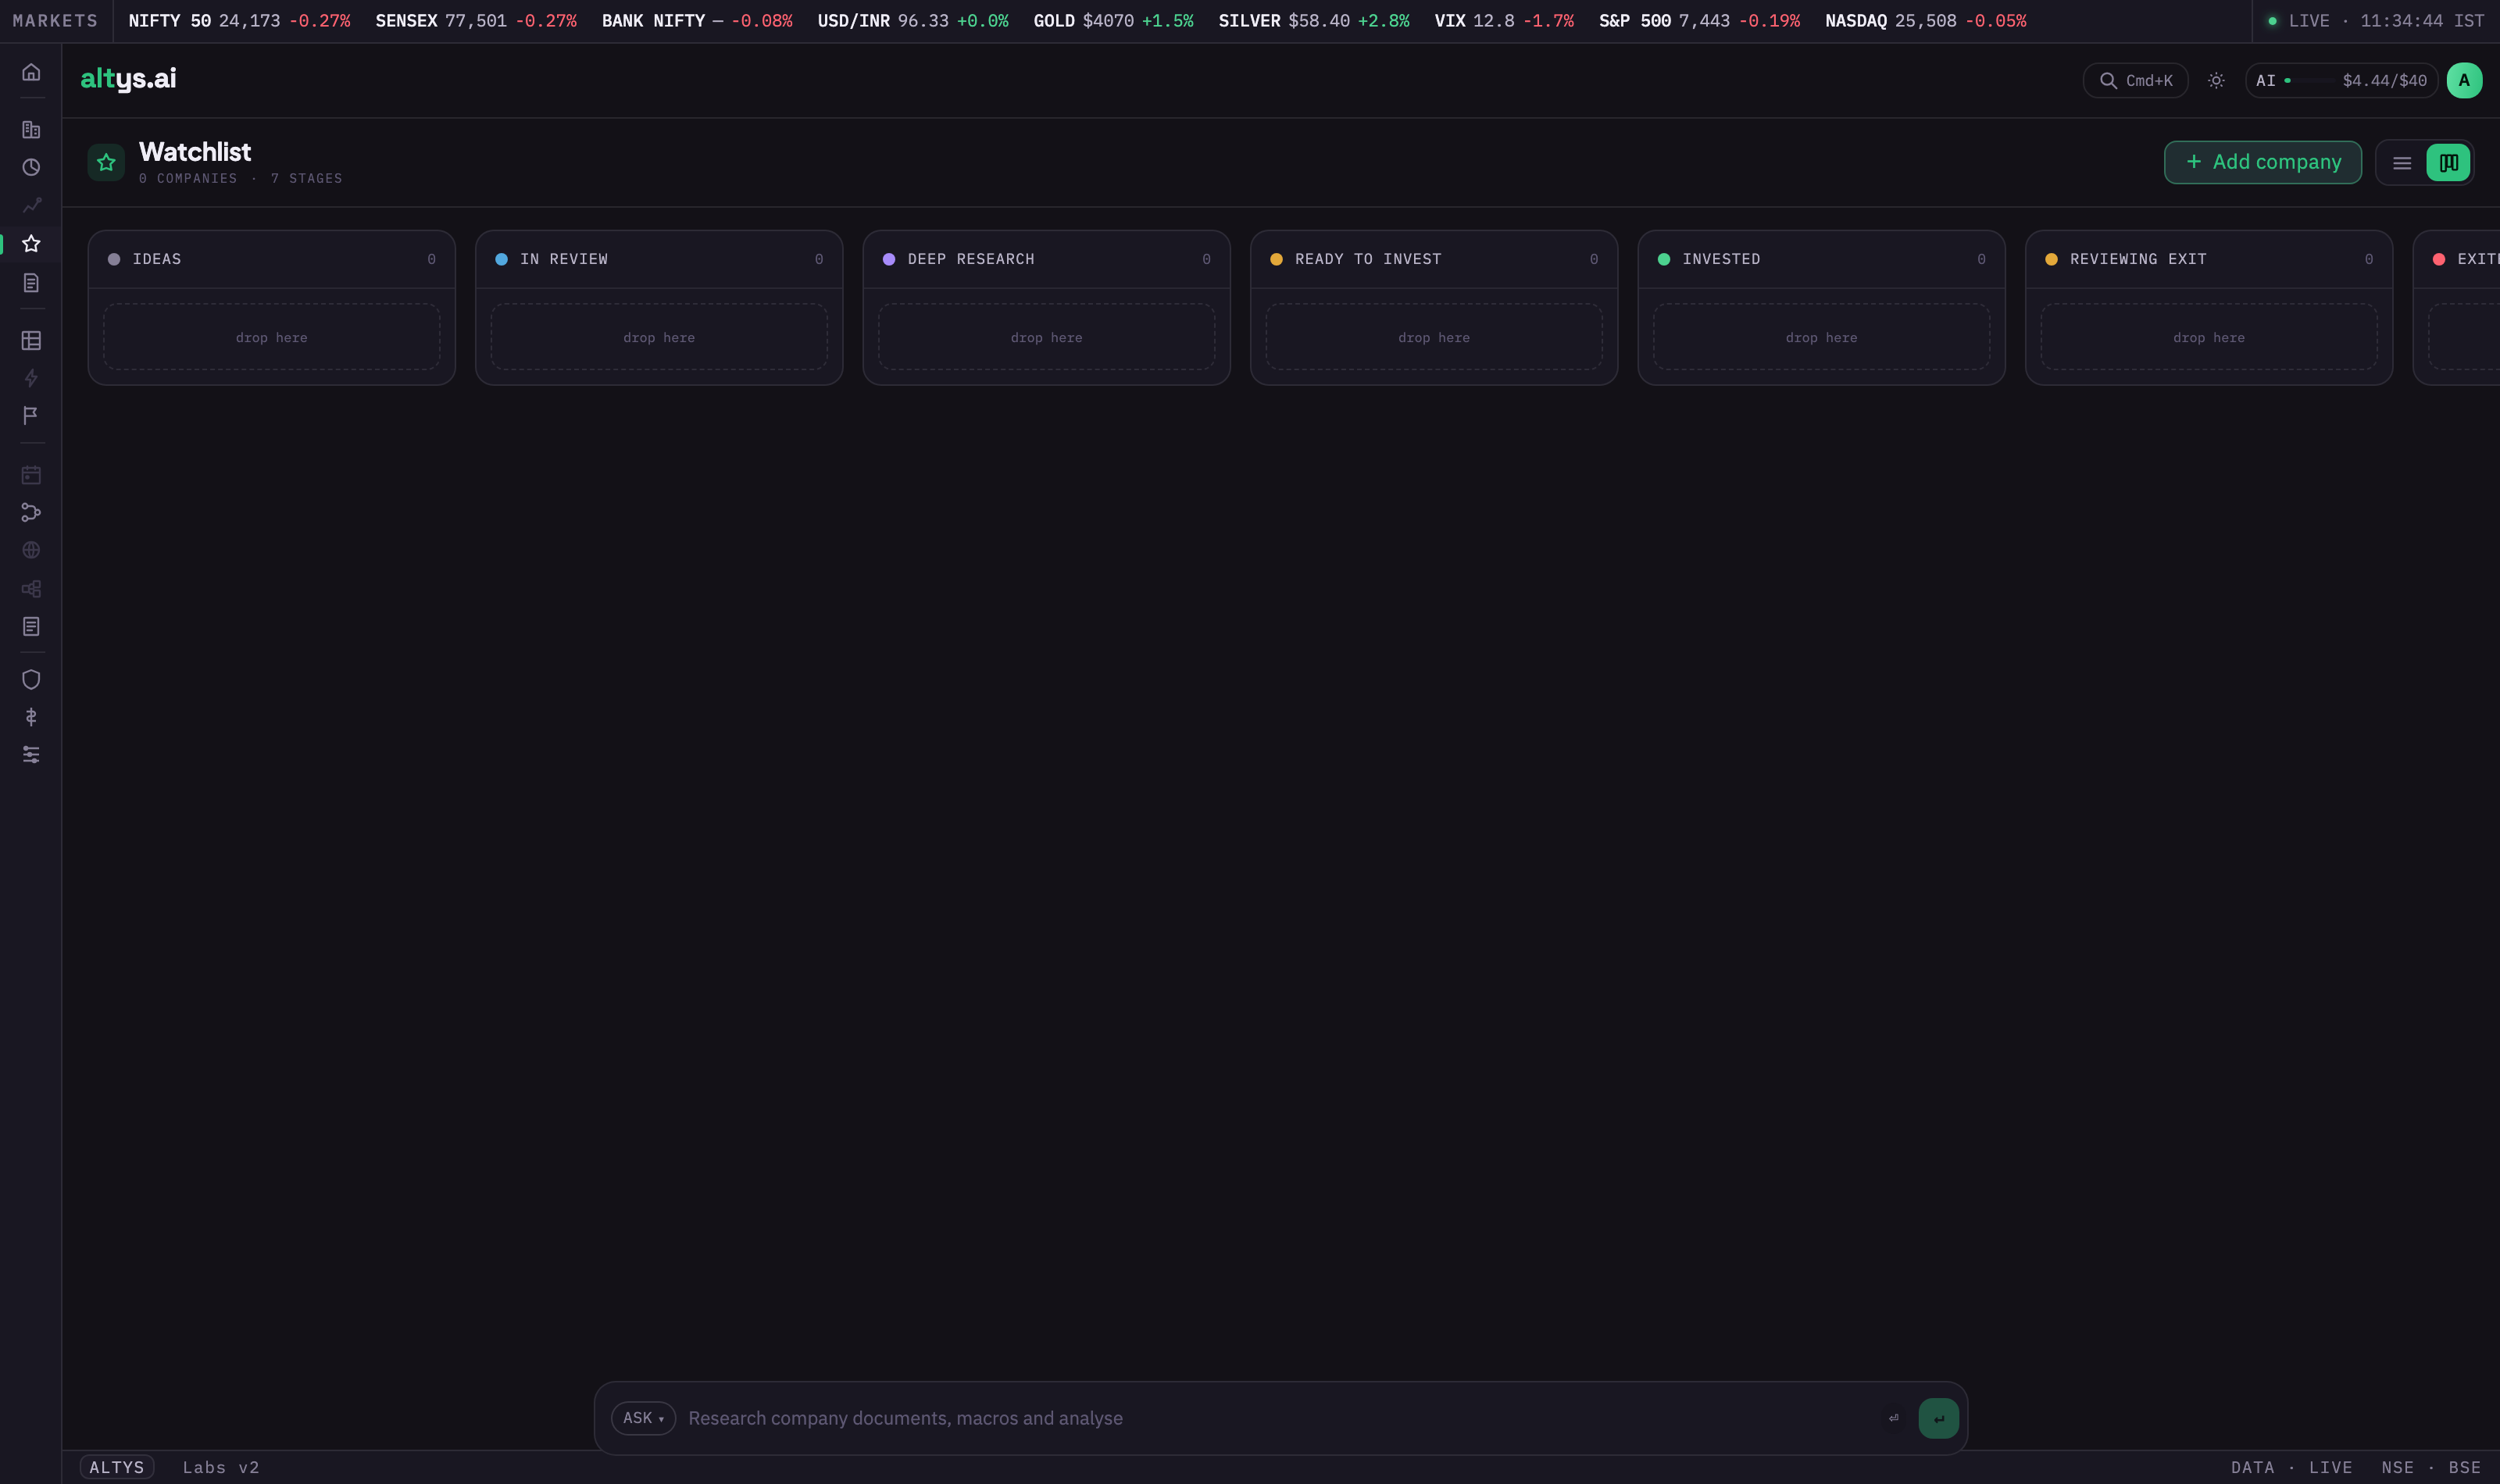
Promising names go into your Watchlist, which is a seven-stage pipeline rather than a flat list: Ideas, In Review, Deep Research, Ready to Invest, Invested, Reviewing Exit, and Exited. Drag a company across stages as your conviction changes, set price alerts and target buy or sell levels, and switch between the kanban board and a sortable factor-score grid.
Explore themes and companies, then dig in
Workbooks are where you think out loud. Ask a question in plain English or run Python on point-in-time data, and every cell traces back to its source. When you want to go deep on one company, the company console gives you fundamentals, forensics, and forecasts on a single canvas.
Start from a workbook
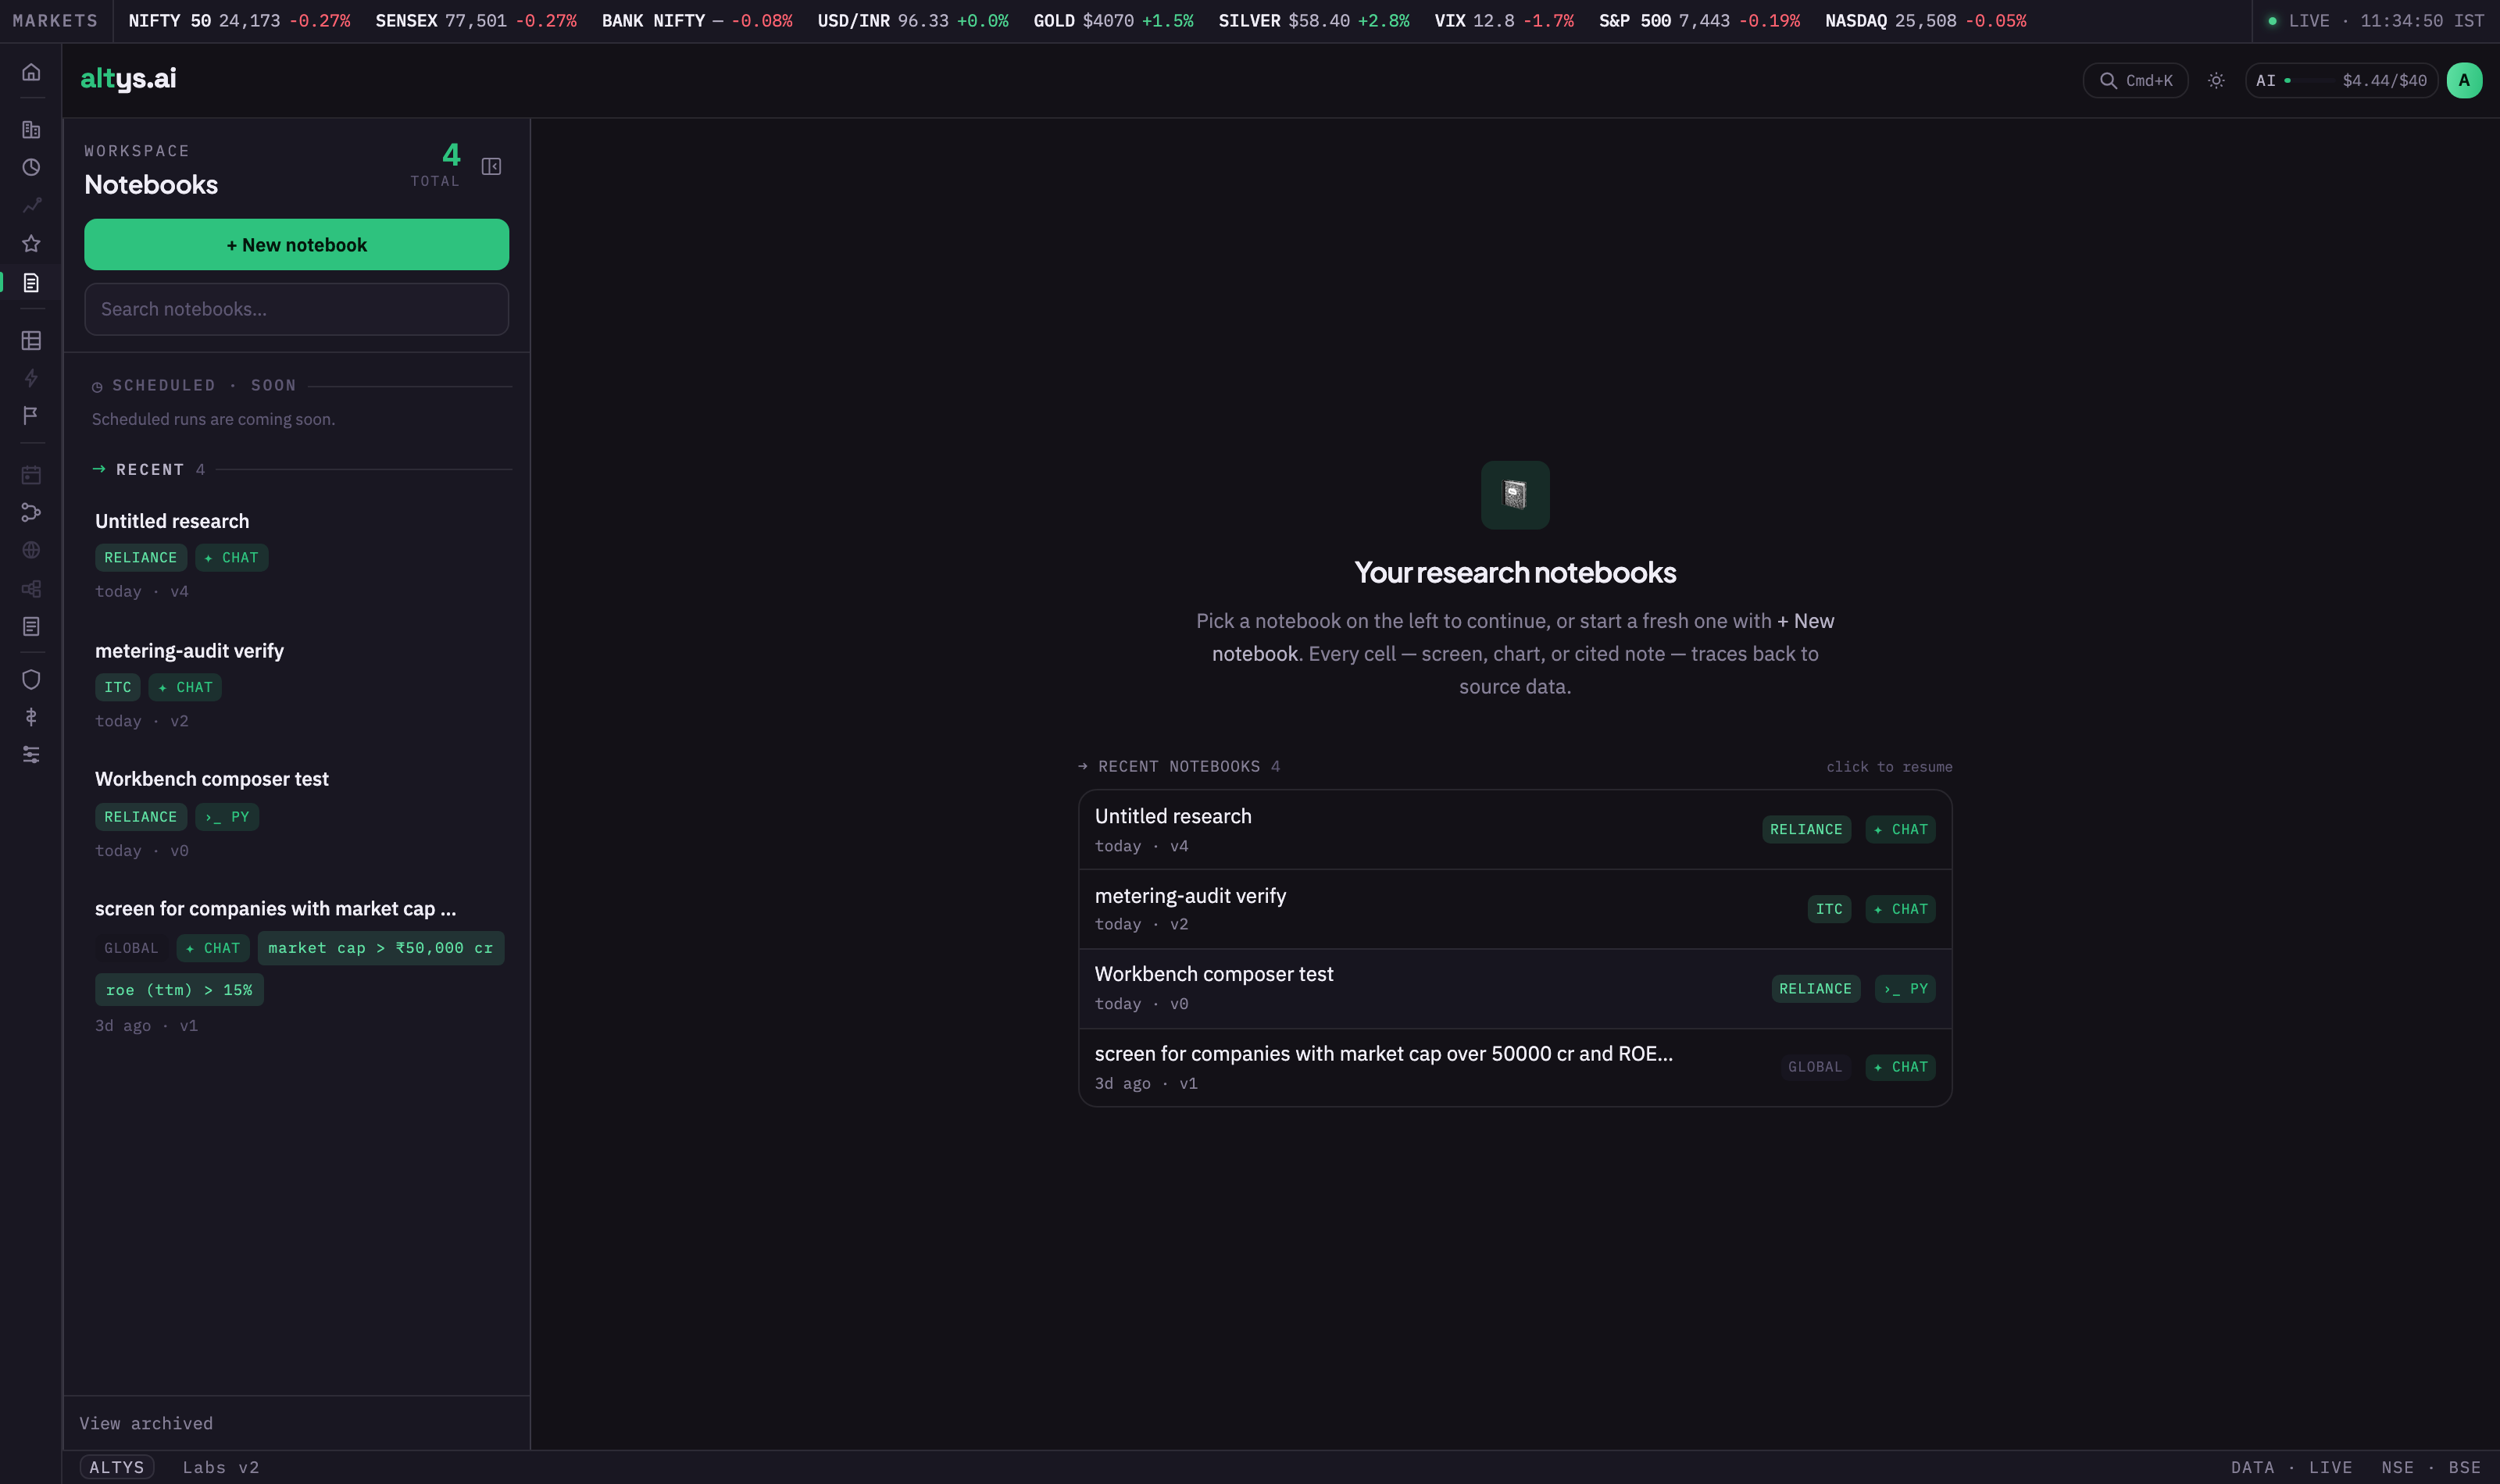
Open Workbooks for your notebook gallery. Each notebook is tagged by scope (a single company or the whole market) and mode: a chat notebook answers in prose with citations, a Python notebook runs code against the data. Start a new one, or reopen a recent thread and continue where you left off.
Run Python, or just ask
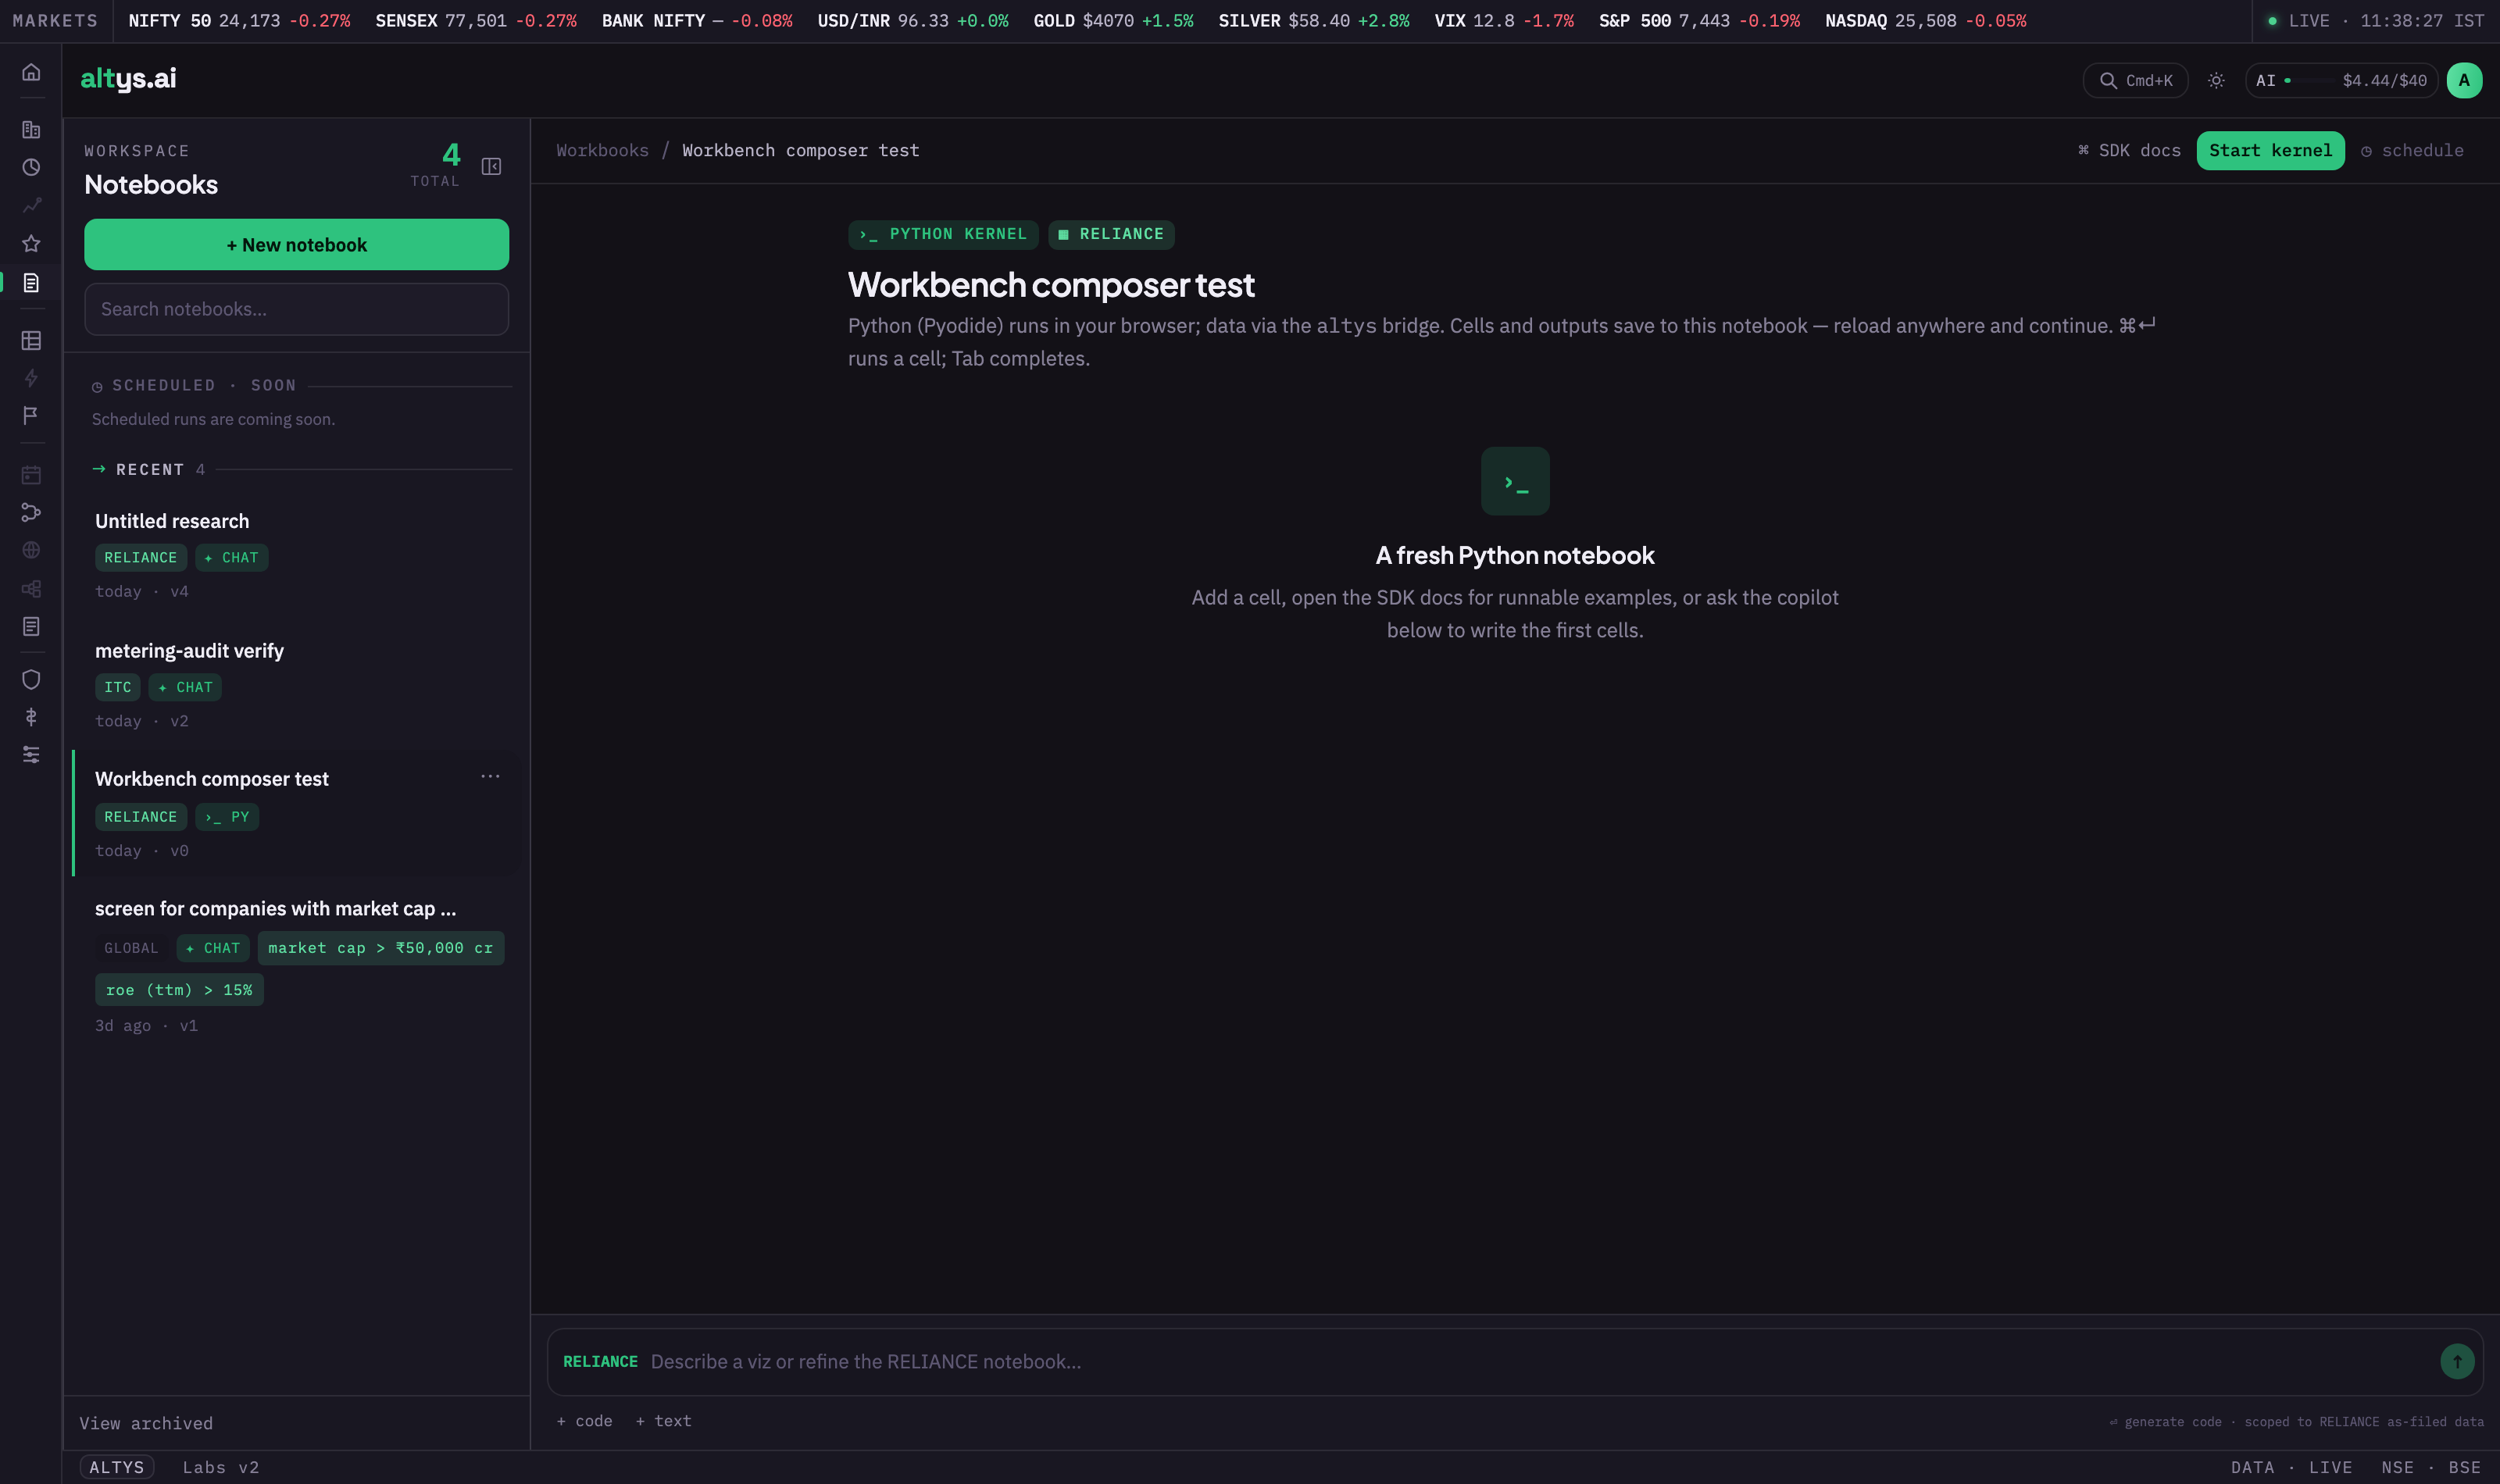
Inside a notebook you can add cells that screen, chart, or run Python on point-in-time data through the Altys SDK. The Python kernel runs in your browser and the copilot at the bottom will write the first cells for you. Cells and outputs save to the notebook, so you can reload anywhere and keep going.
Open the company console
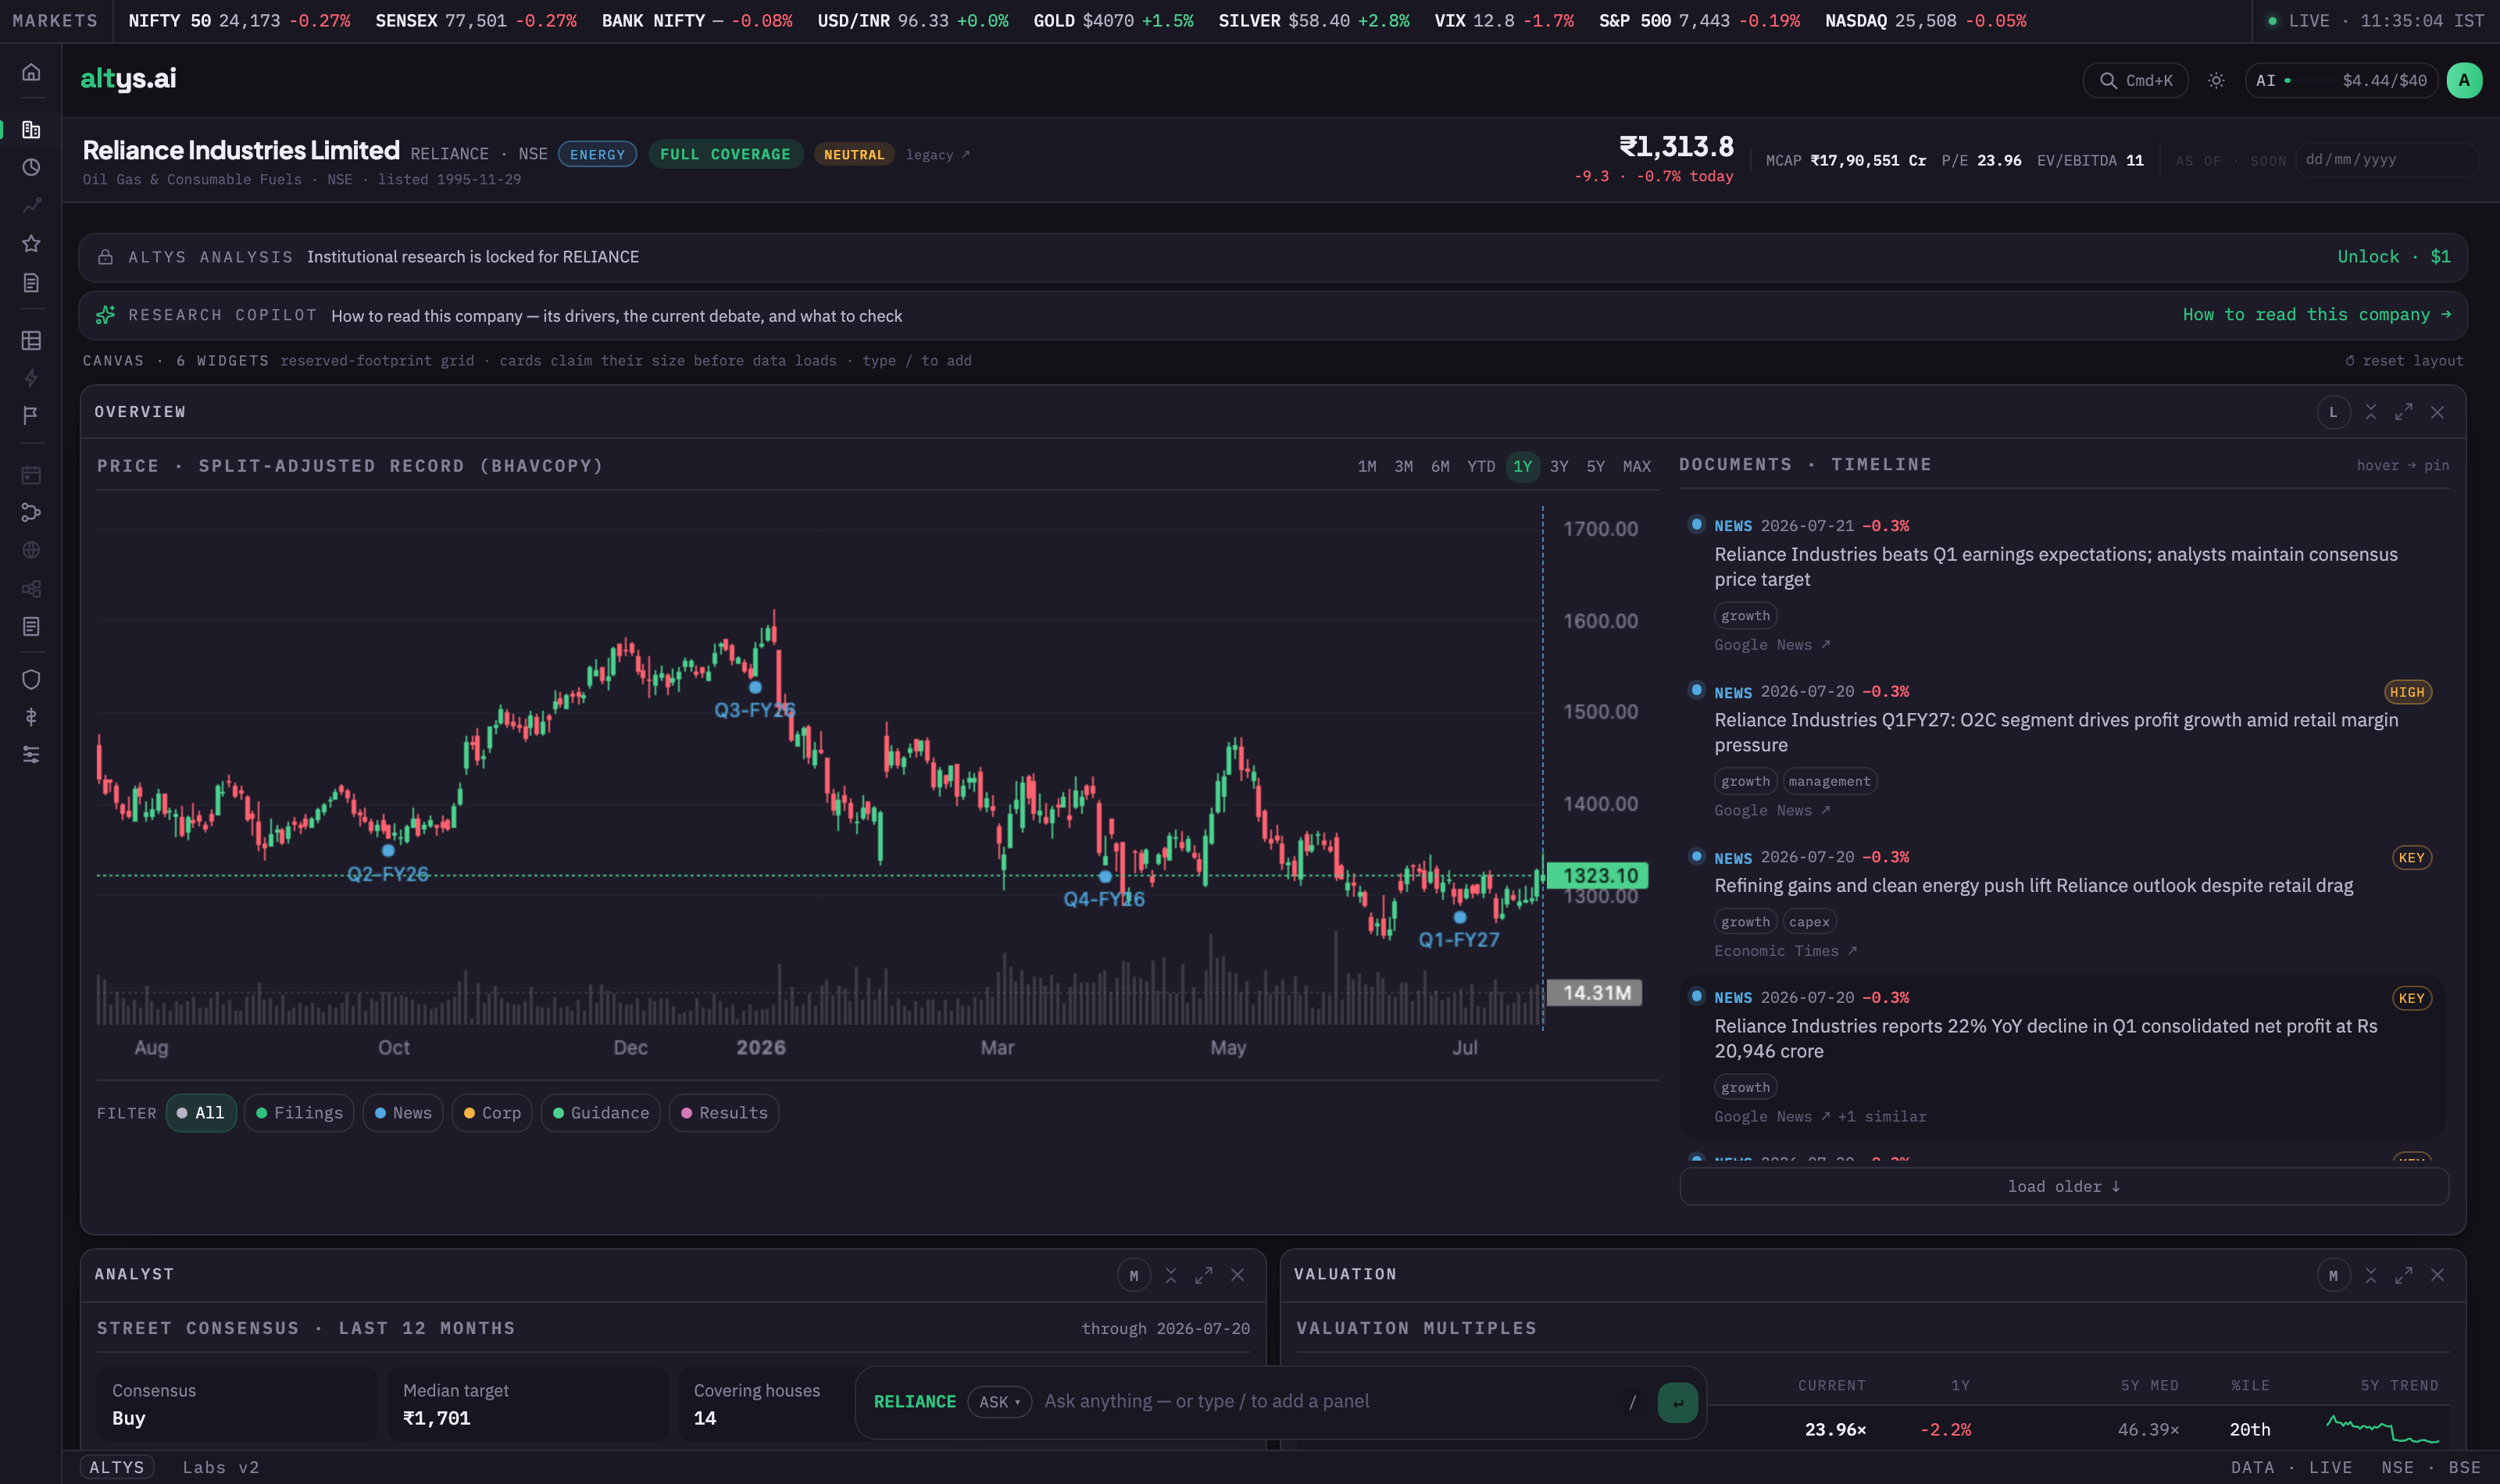
To research one company, go to its console (for example /company/RELIANCE). It is a canvas of widgets: a split-adjusted price chart with earnings markers, a live document and news timeline, analyst consensus, and valuation multiples. The Research Copilot band up top explains how to read the company, its drivers, and what to check.
Check the fundamentals and the revenue blueprint
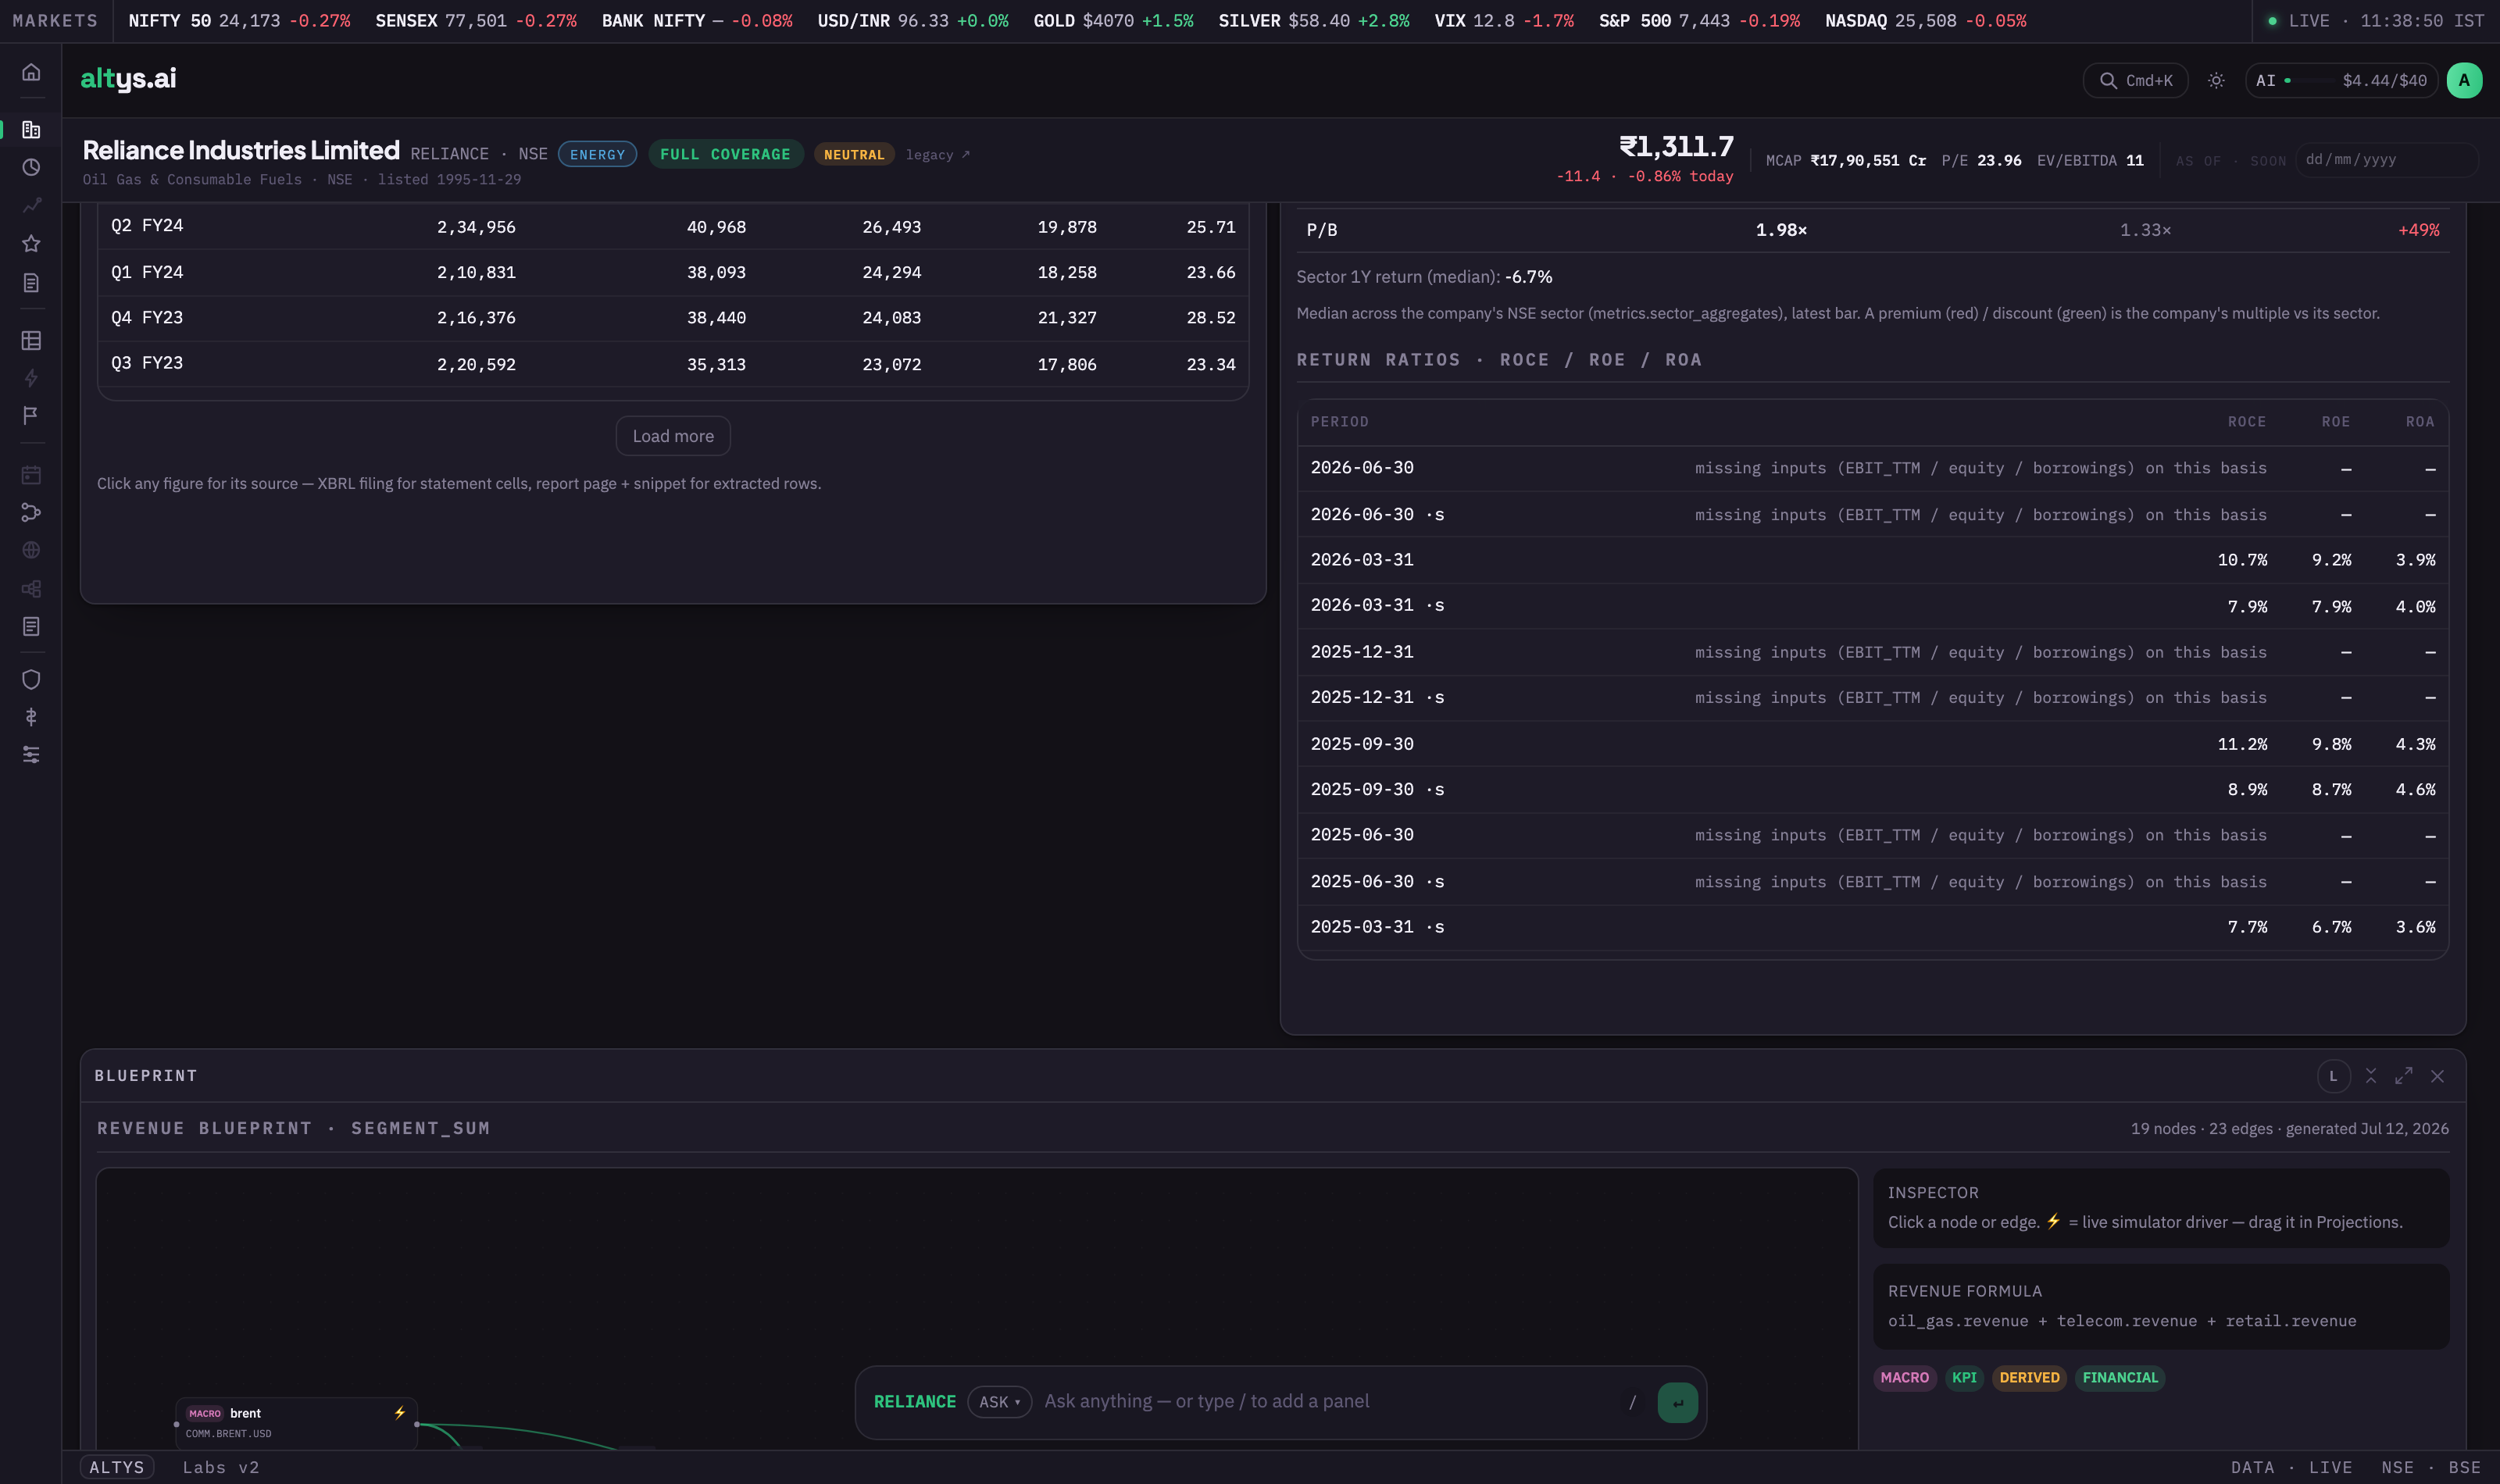
Add widgets by typing / in the ask bar at the bottom. Pull in the financial statements, valuation multiples versus the company's own sector, and return ratios (ROCE, ROE, ROA) laid out by period. The revenue blueprint shows the company's revenue as a formula, so you can see exactly which segments drive the top line. Click any figure to jump to its source filing.
Read the forecast and the cash-quality forensics
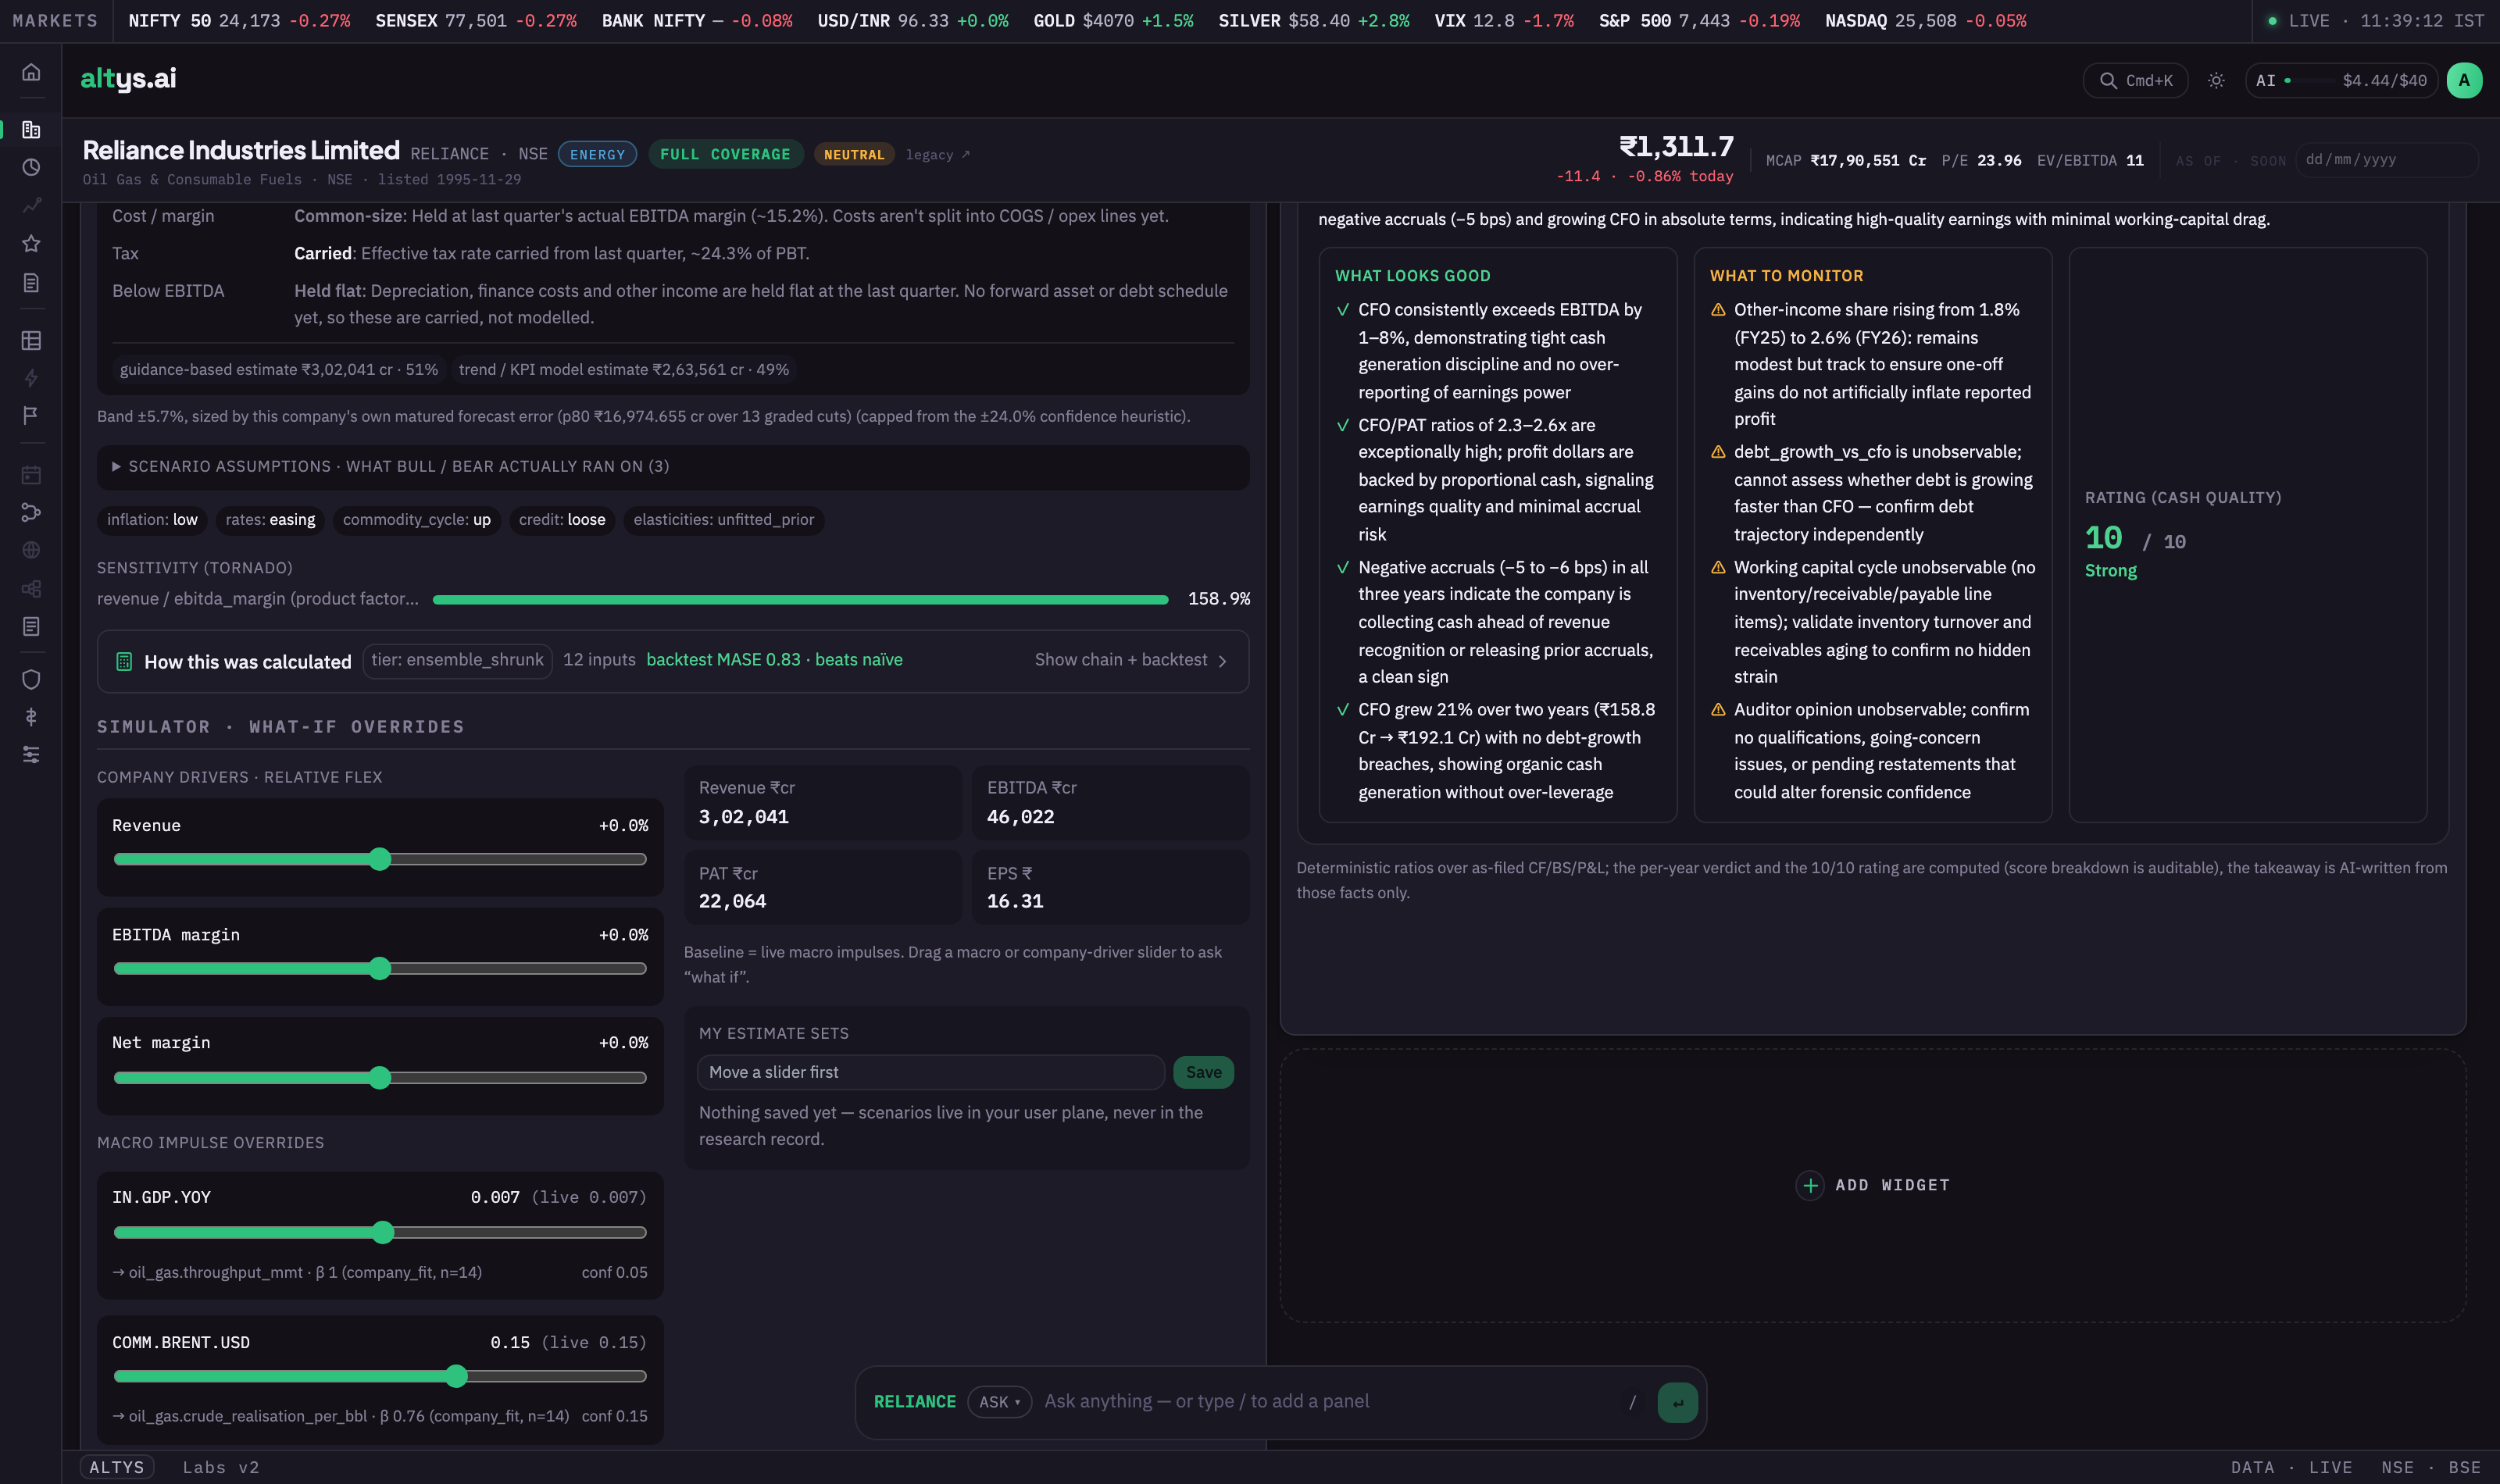
The Projections widget is a forward model you can drive: sliders for revenue, margins, and macro impulses (GDP, Brent) let you run what-if scenarios, with a sensitivity tornado and a plain-English note on how the estimate was built. Next to it, the Forensics card scores cash quality from 0 to 10, with what looks good and what to monitor written from the as-filed cash flow, balance sheet, and P&L.
Track a strategy forward, and re-evaluate when it drifts
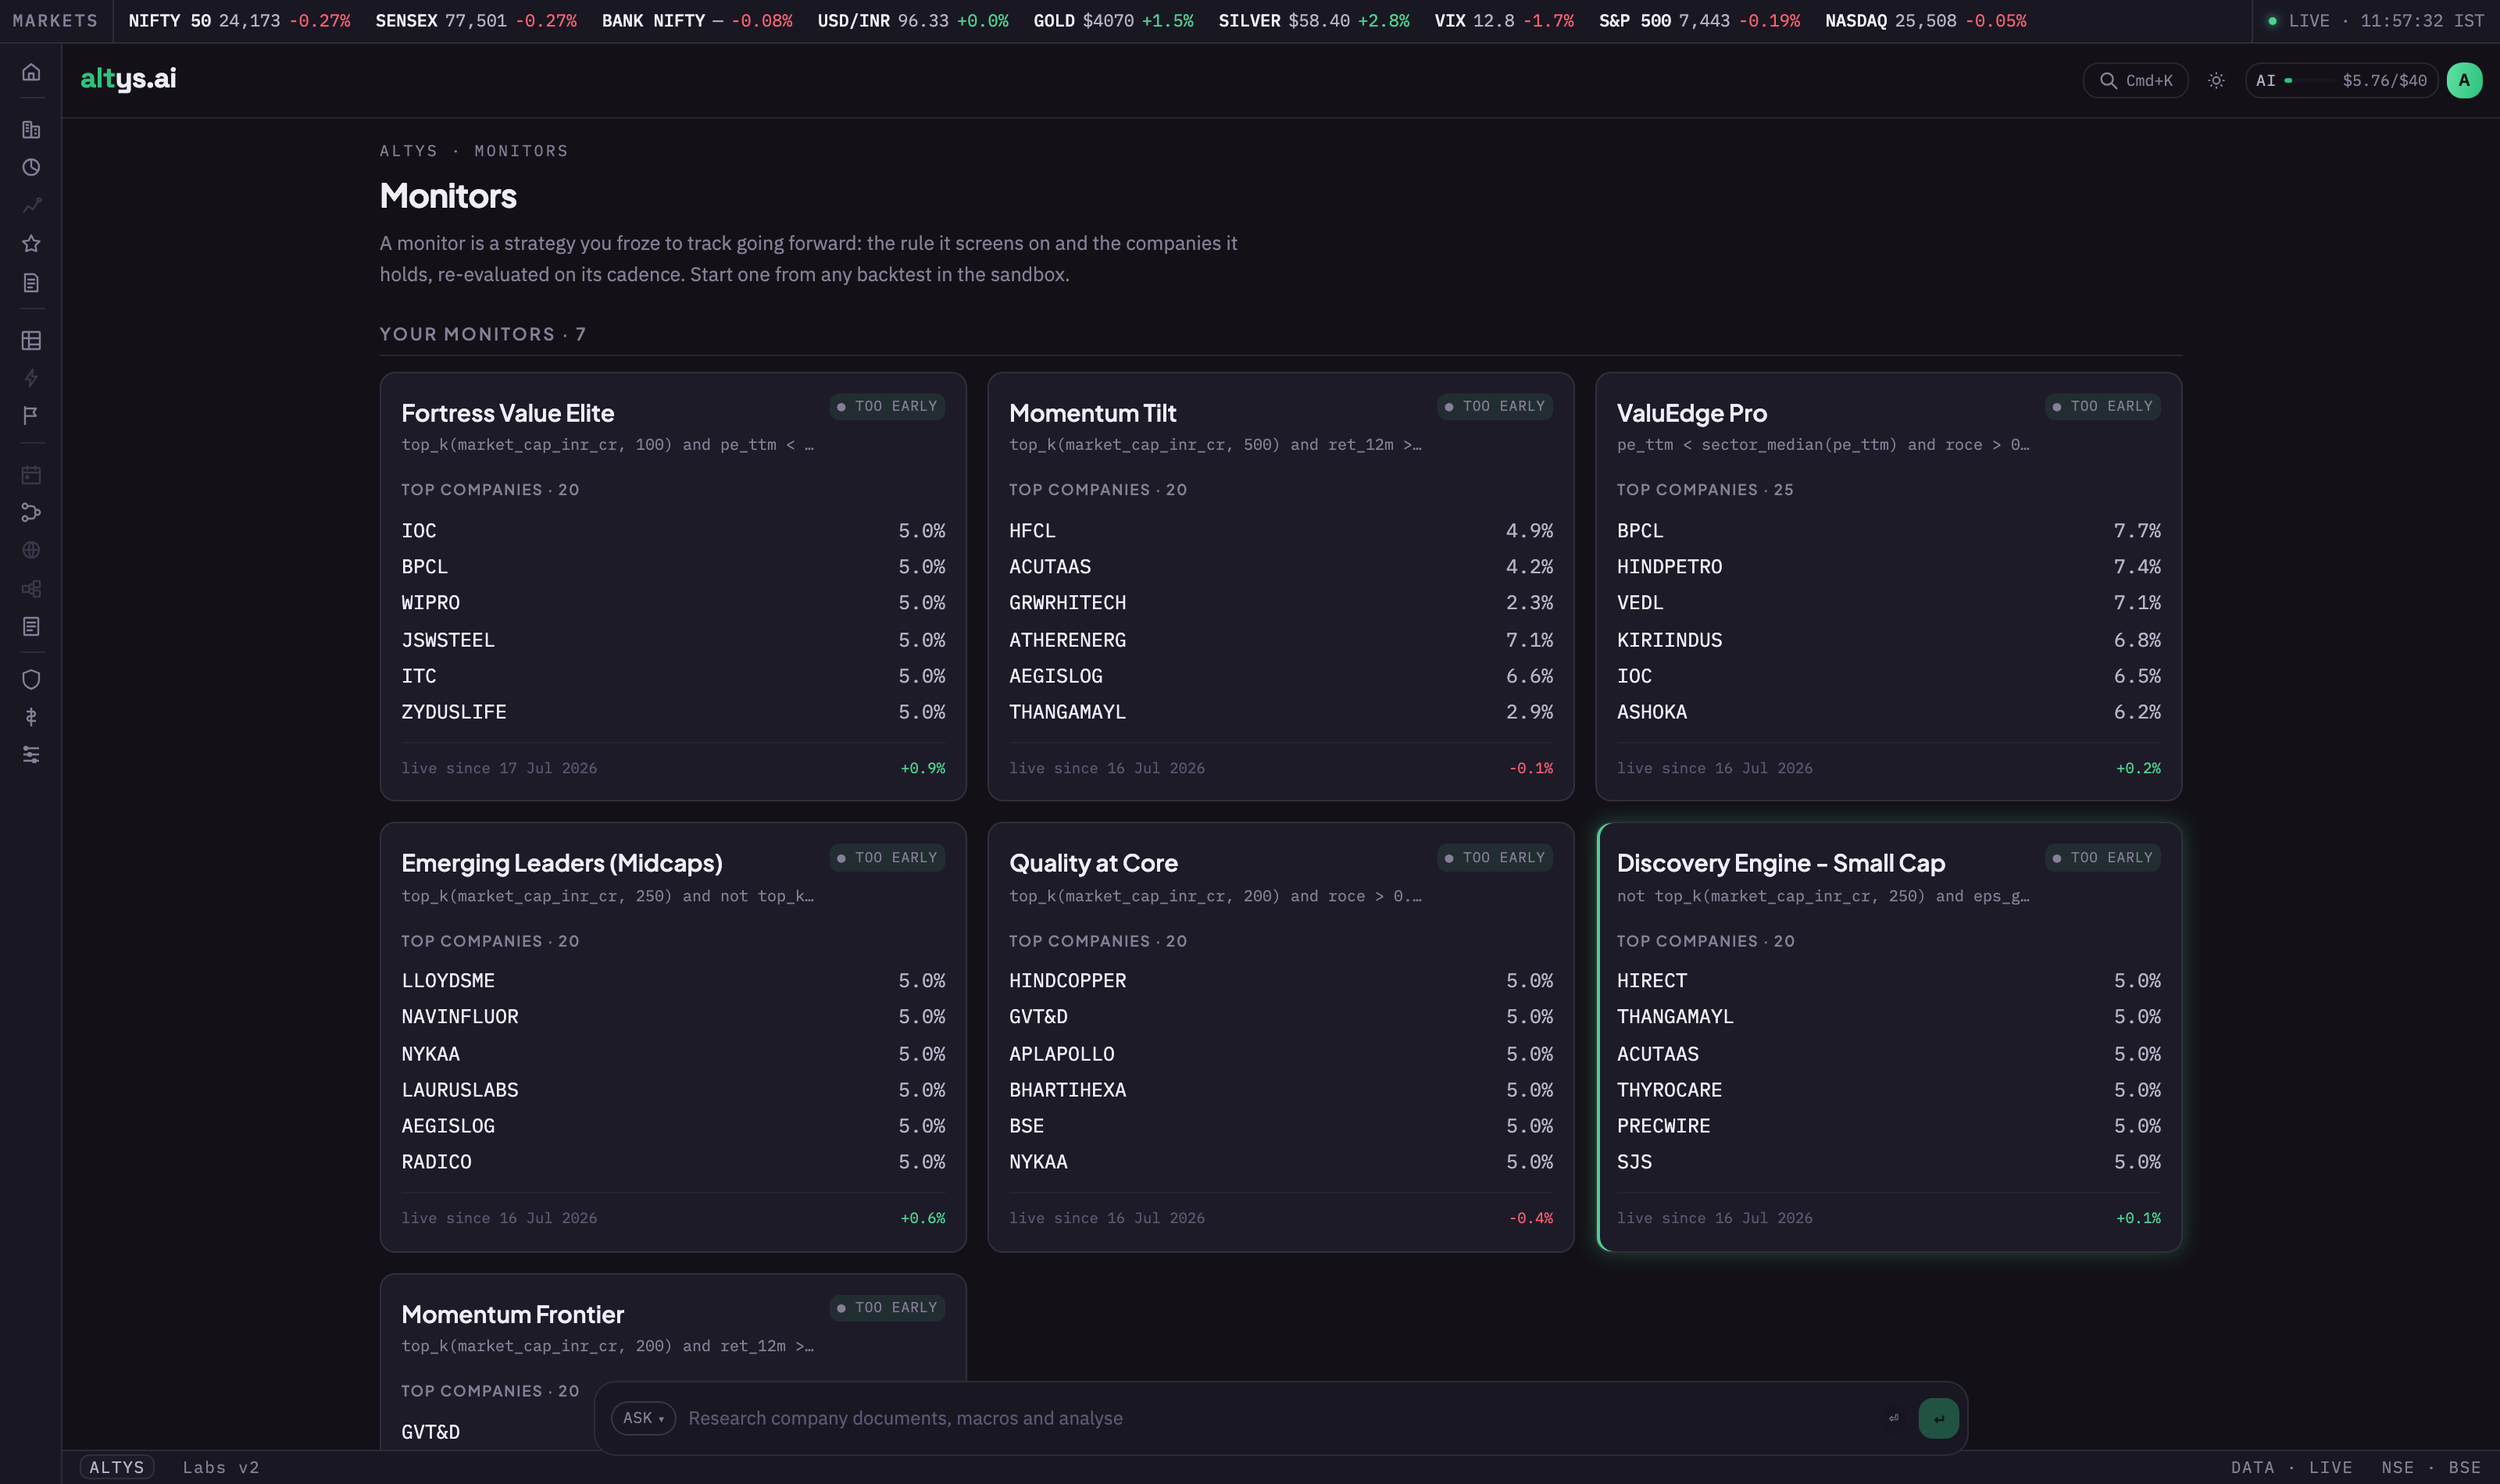
A monitor is a strategy you froze to track going forward: the rule it screens on and the companies it holds, re-evaluated on its cadence. It is how you tell whether a backtest holds up out of sample.
Freeze a strategy into a monitor
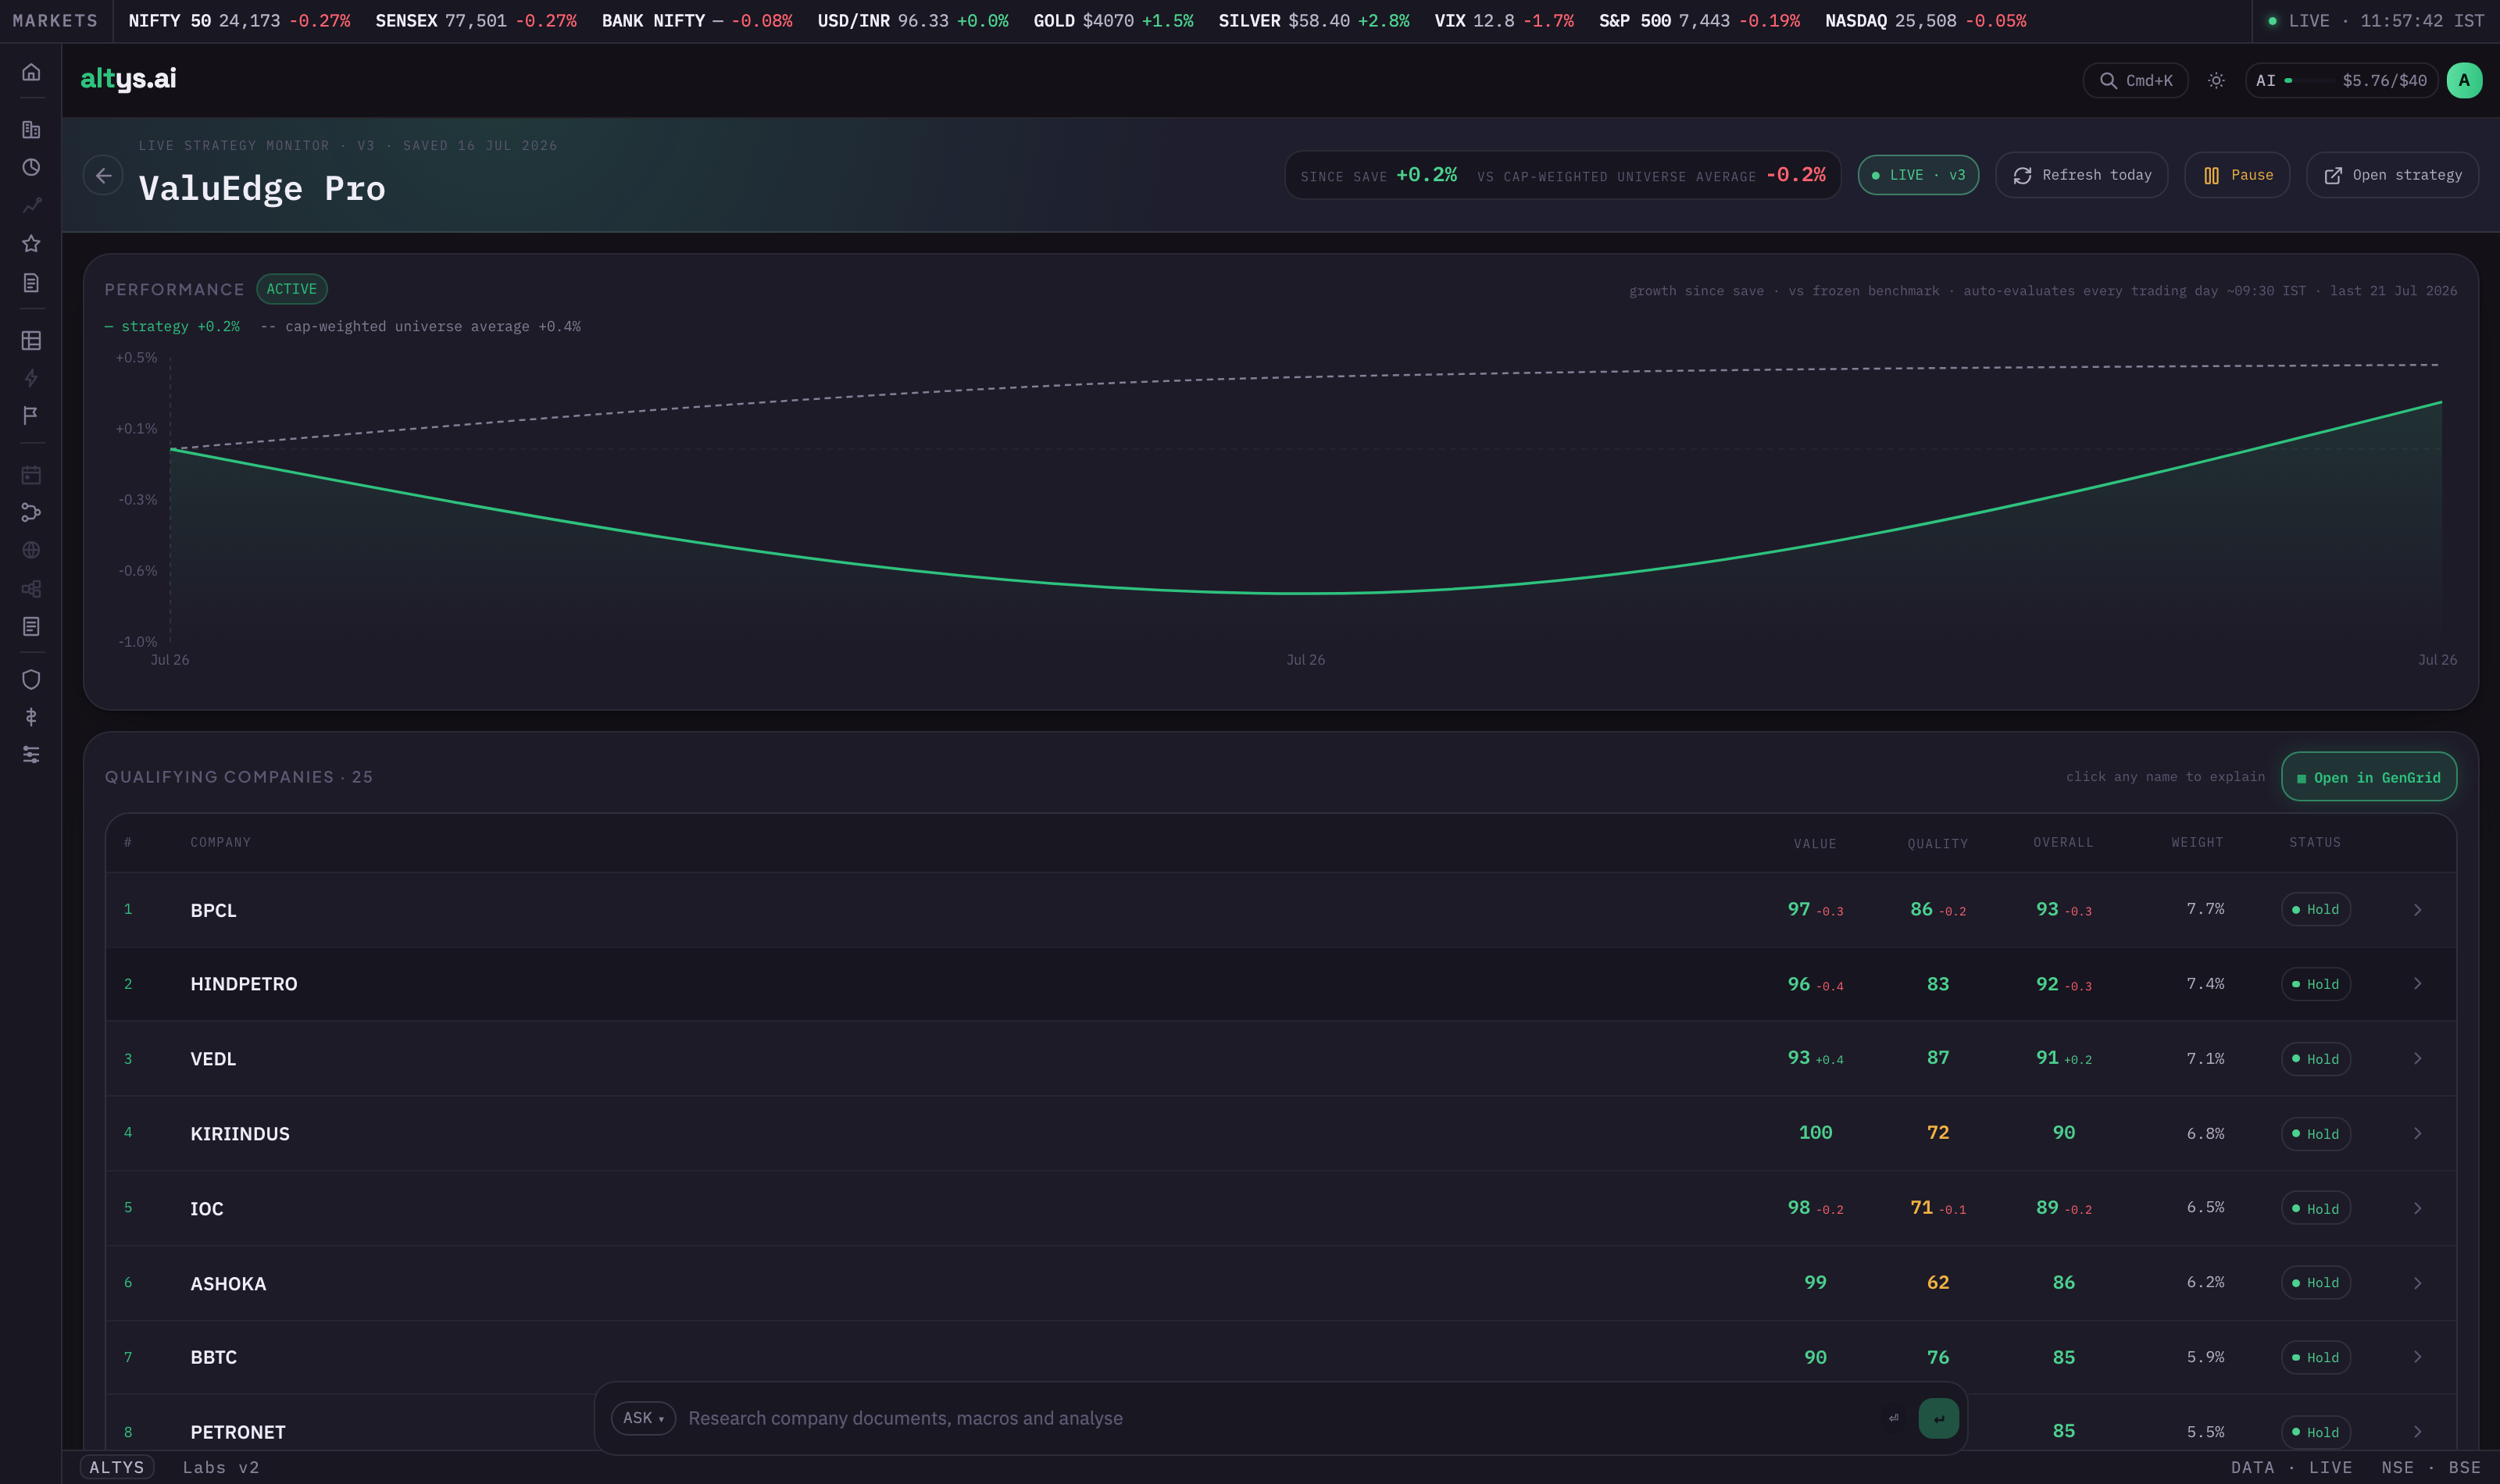
From any backtest, choose Start forward test. That seals the current version and starts tracking it from today. Saving and monitoring are deliberately separate, so an active monitor never changes underneath you. The Monitors surface then lists everything you are tracking, each card showing the rule, its current holdings and weights, and how it has done since you saved it.
Watch holdings, rebalances, and health
Open a monitor for the full view: performance since save against a frozen benchmark, the qualifying companies with their Value, Quality, and Overall scores and weights, and a per-name Hold or drop status from a deterministic "why included" check. Refresh it for today, pause it, or jump straight back to the strategy it came from.
Re-evaluate when health slips
When the health verdict degrades or the holdings drift, that is your signal to go back to the strategy workspace, adjust the definition, and test a new candidate version. Because every version is sealed, you can compare the new one against the one you are running before you switch.
Cmd+K is the fastest way through the whole tool
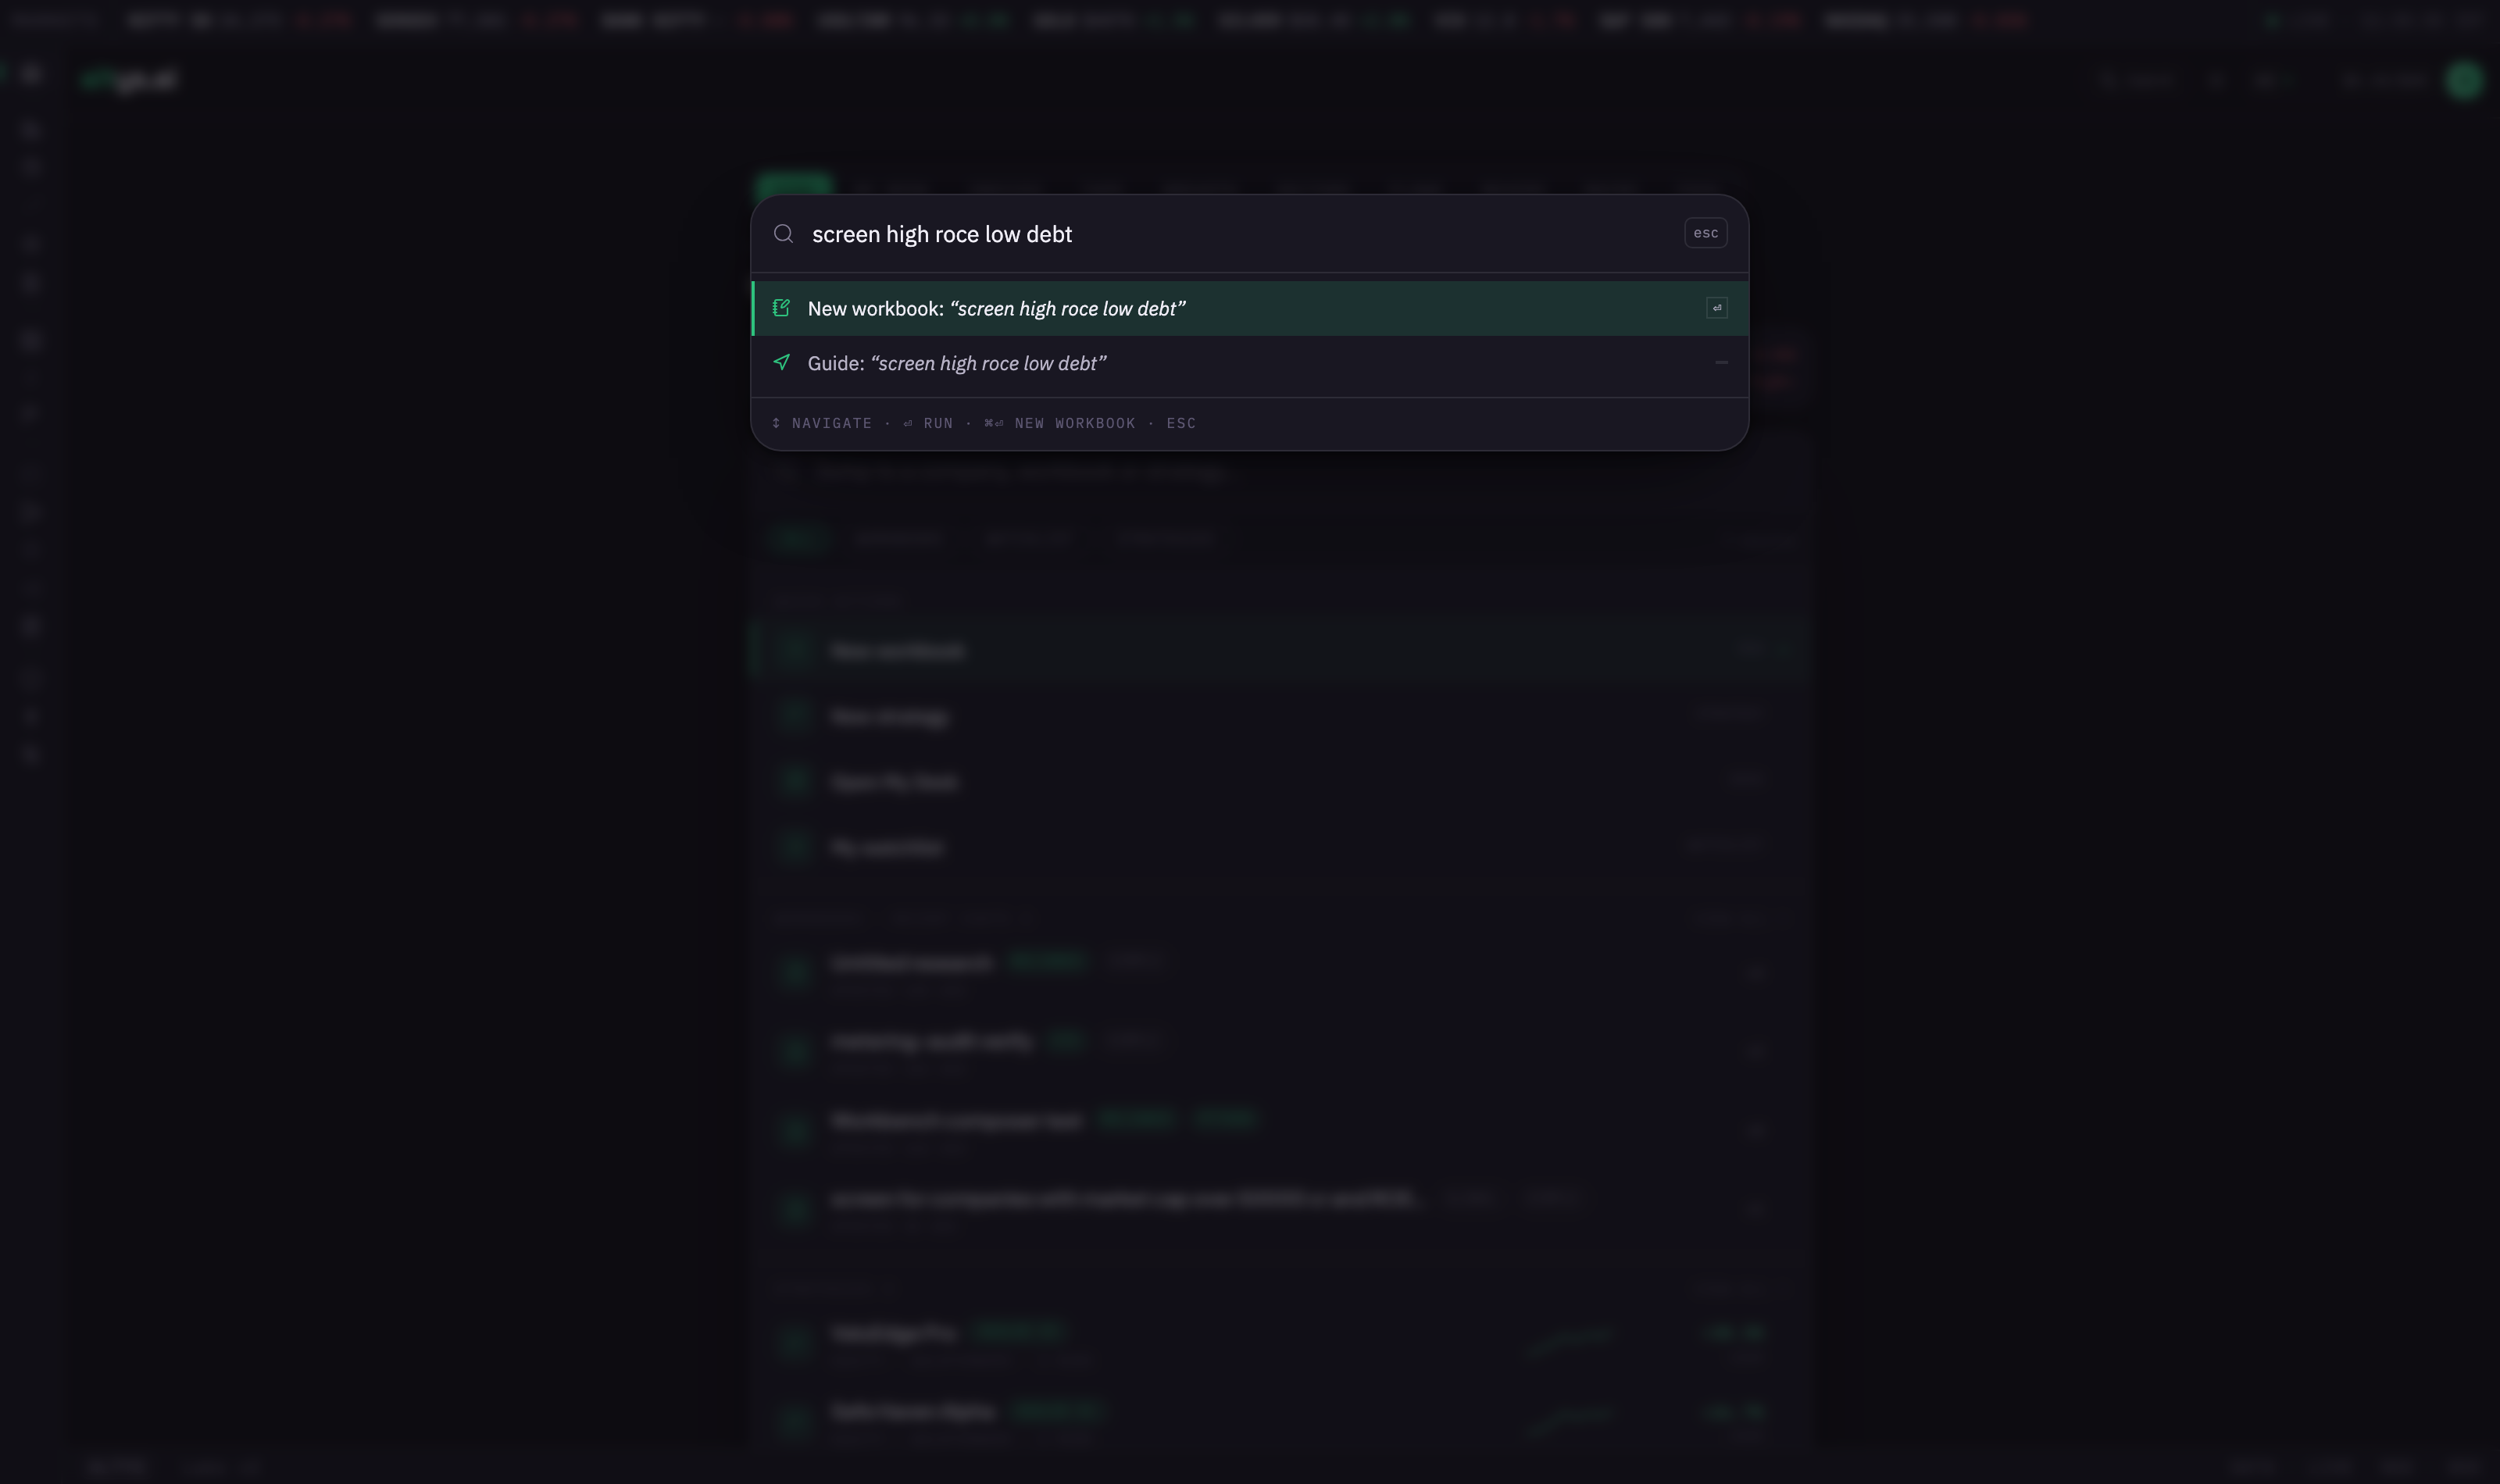
Press Cmd K (or Ctrl K) anywhere and one box handles four different intents. You rarely need to hunt through menus.
One box, four intents
Type a ticker to jump to a company. Type a surface name to jump anywhere in the app. Ask a single-fact question and it answers inline. Type a research or screen query (compare, top, rank, screen, peers) and it opens a new workbook to work it out. The palette reads what you typed and routes it, showing the lane it will use before you commit.
Keys worth knowing
Inside the palette, ↑ ↓ move between results, Enter runs the highlighted one, Cmd Enter forces a new workbook, and Esc closes it. Elsewhere in the app, Cmd G opens the guide agent and Cmd / lists hotkeys.
Read the regime, rates, and commodities
The top-level context lives in the Terminal tabs. The Macro tab is a single board for the market backdrop, Indices gives any series a full technical read, My Desk is your personalised morning view, and the rest break out flows, sectors, breadth, and movers.
Open the Macro tab
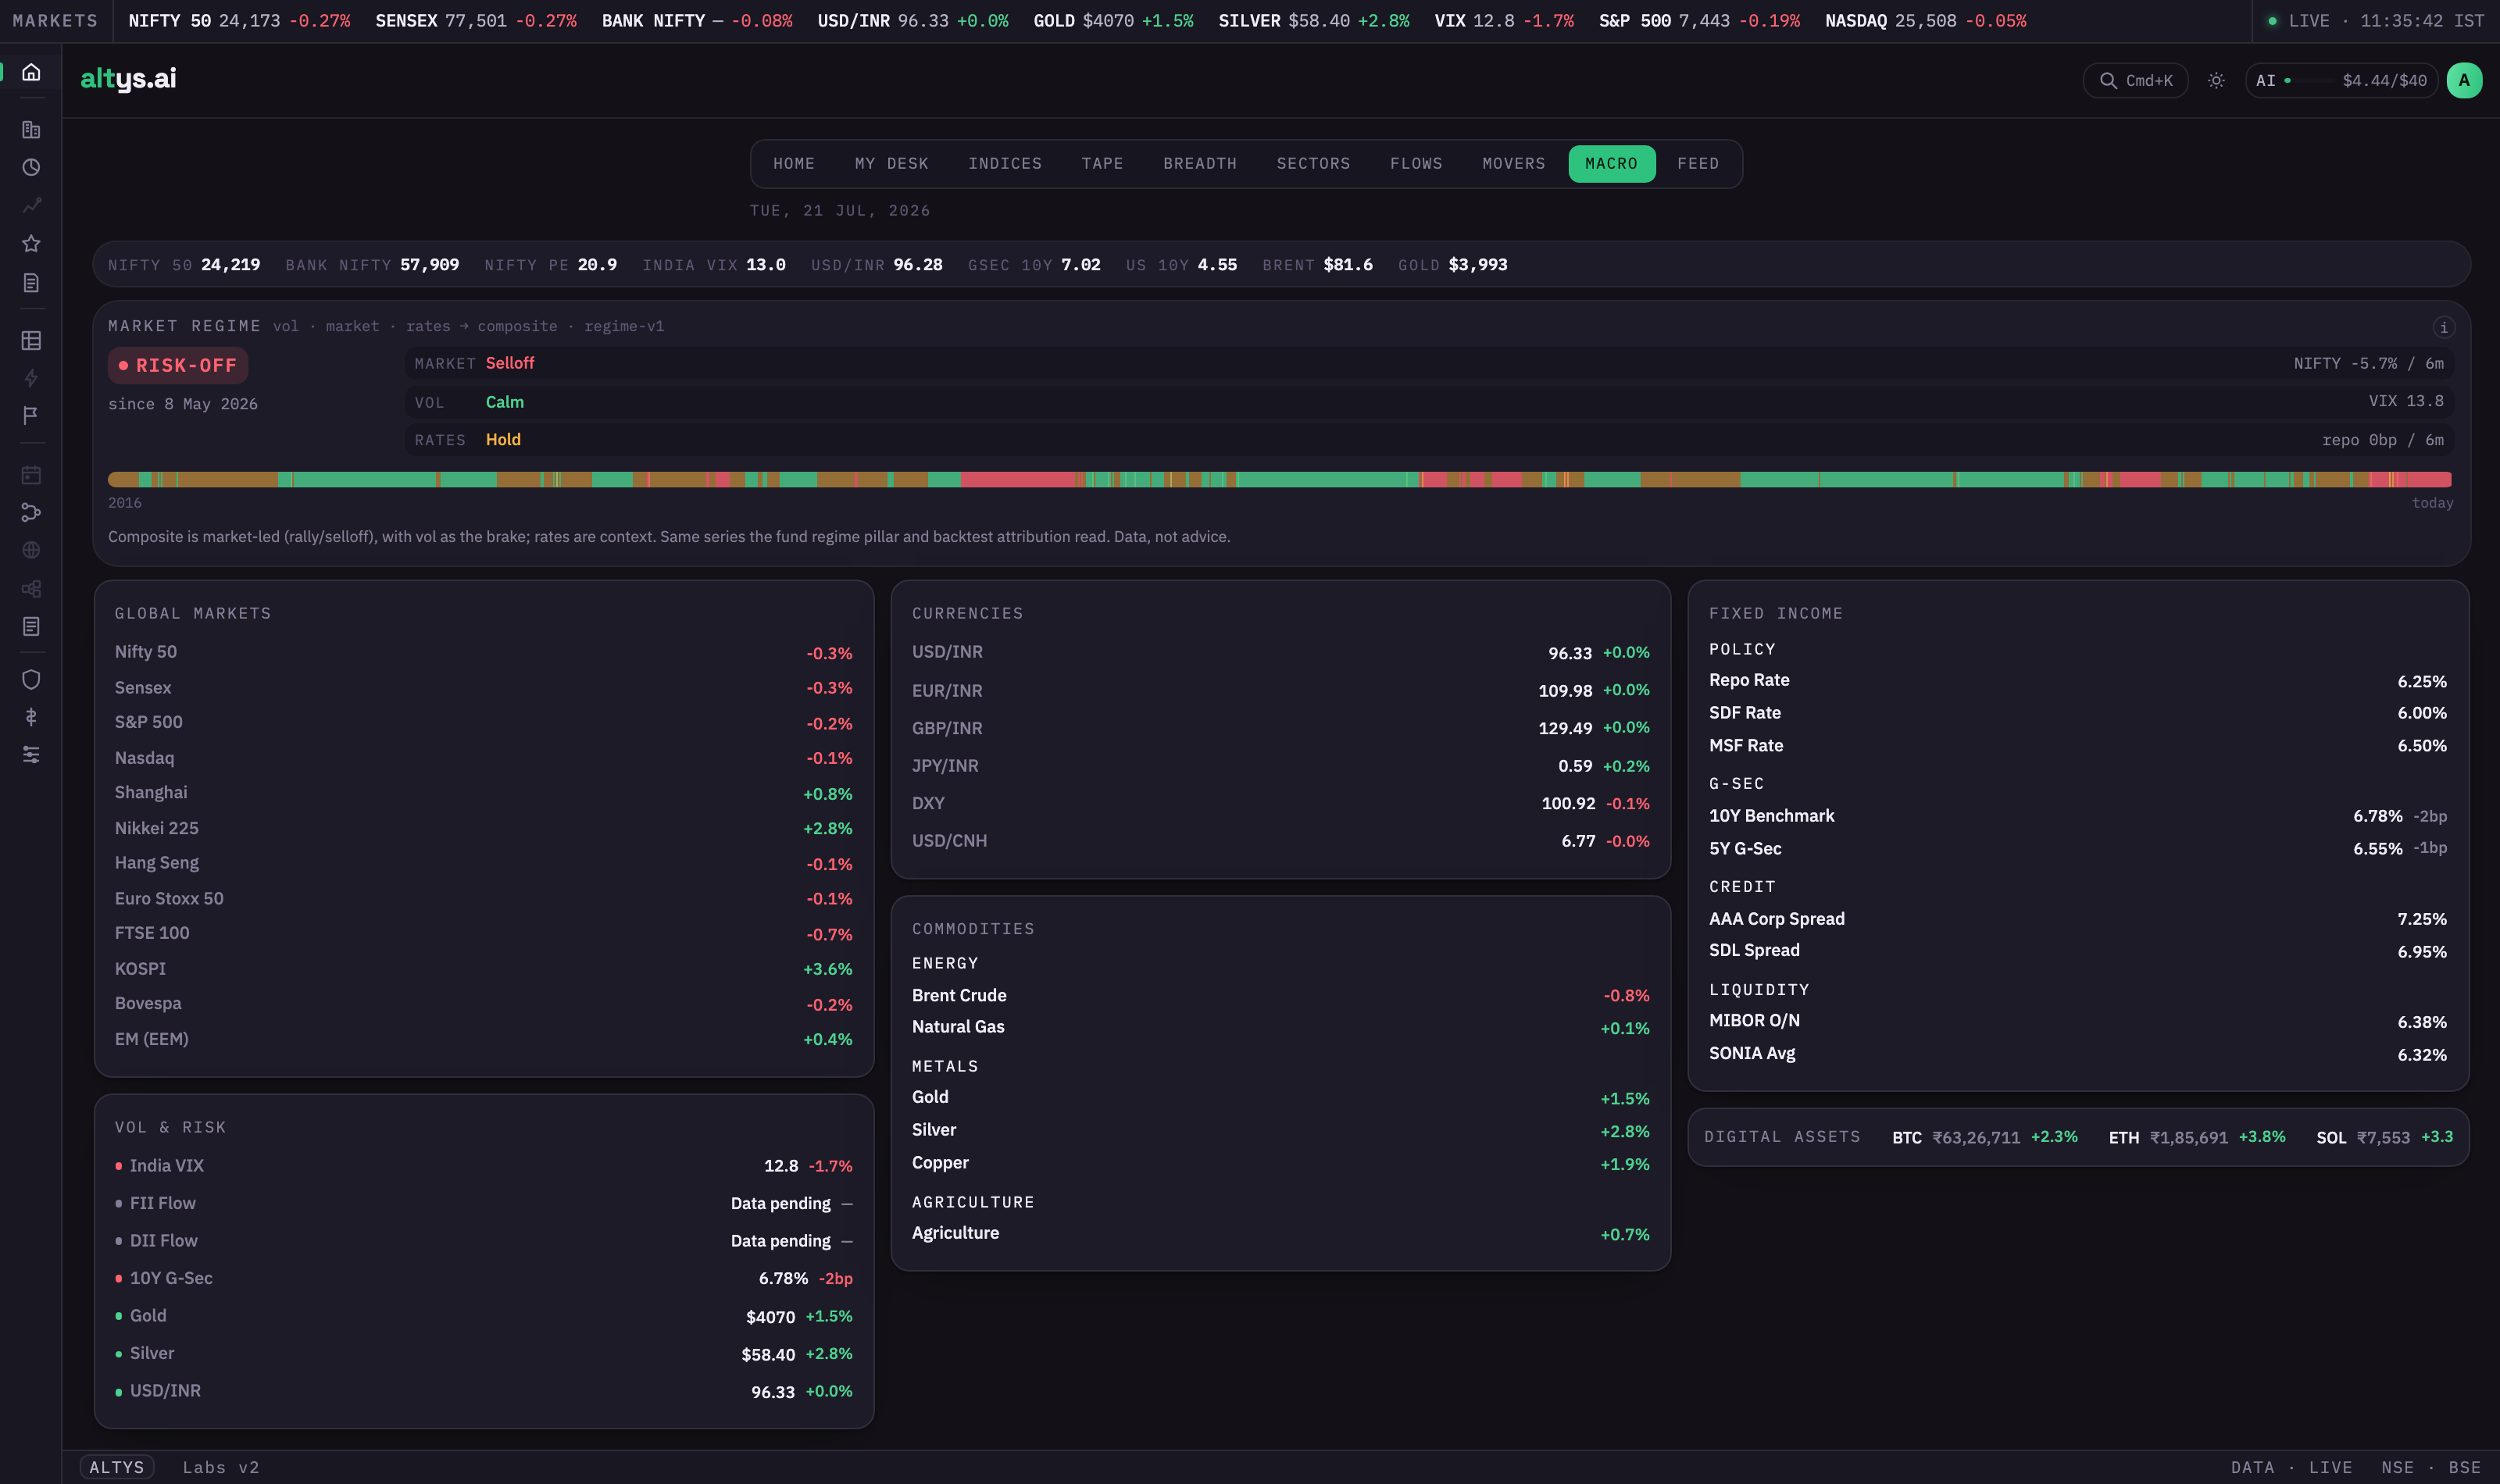
From the Terminal, choose the Macro tab. Up top is a market-regime read (risk-on or risk-off, with volatility and rates as context) plotted back to 2016. Below it, global markets, currencies, commodities across energy, metals, and agriculture, the full fixed-income stack (policy rates, G-secs, credit spreads, liquidity), and digital assets, all on one screen.
Drill into an index on the Indices tab
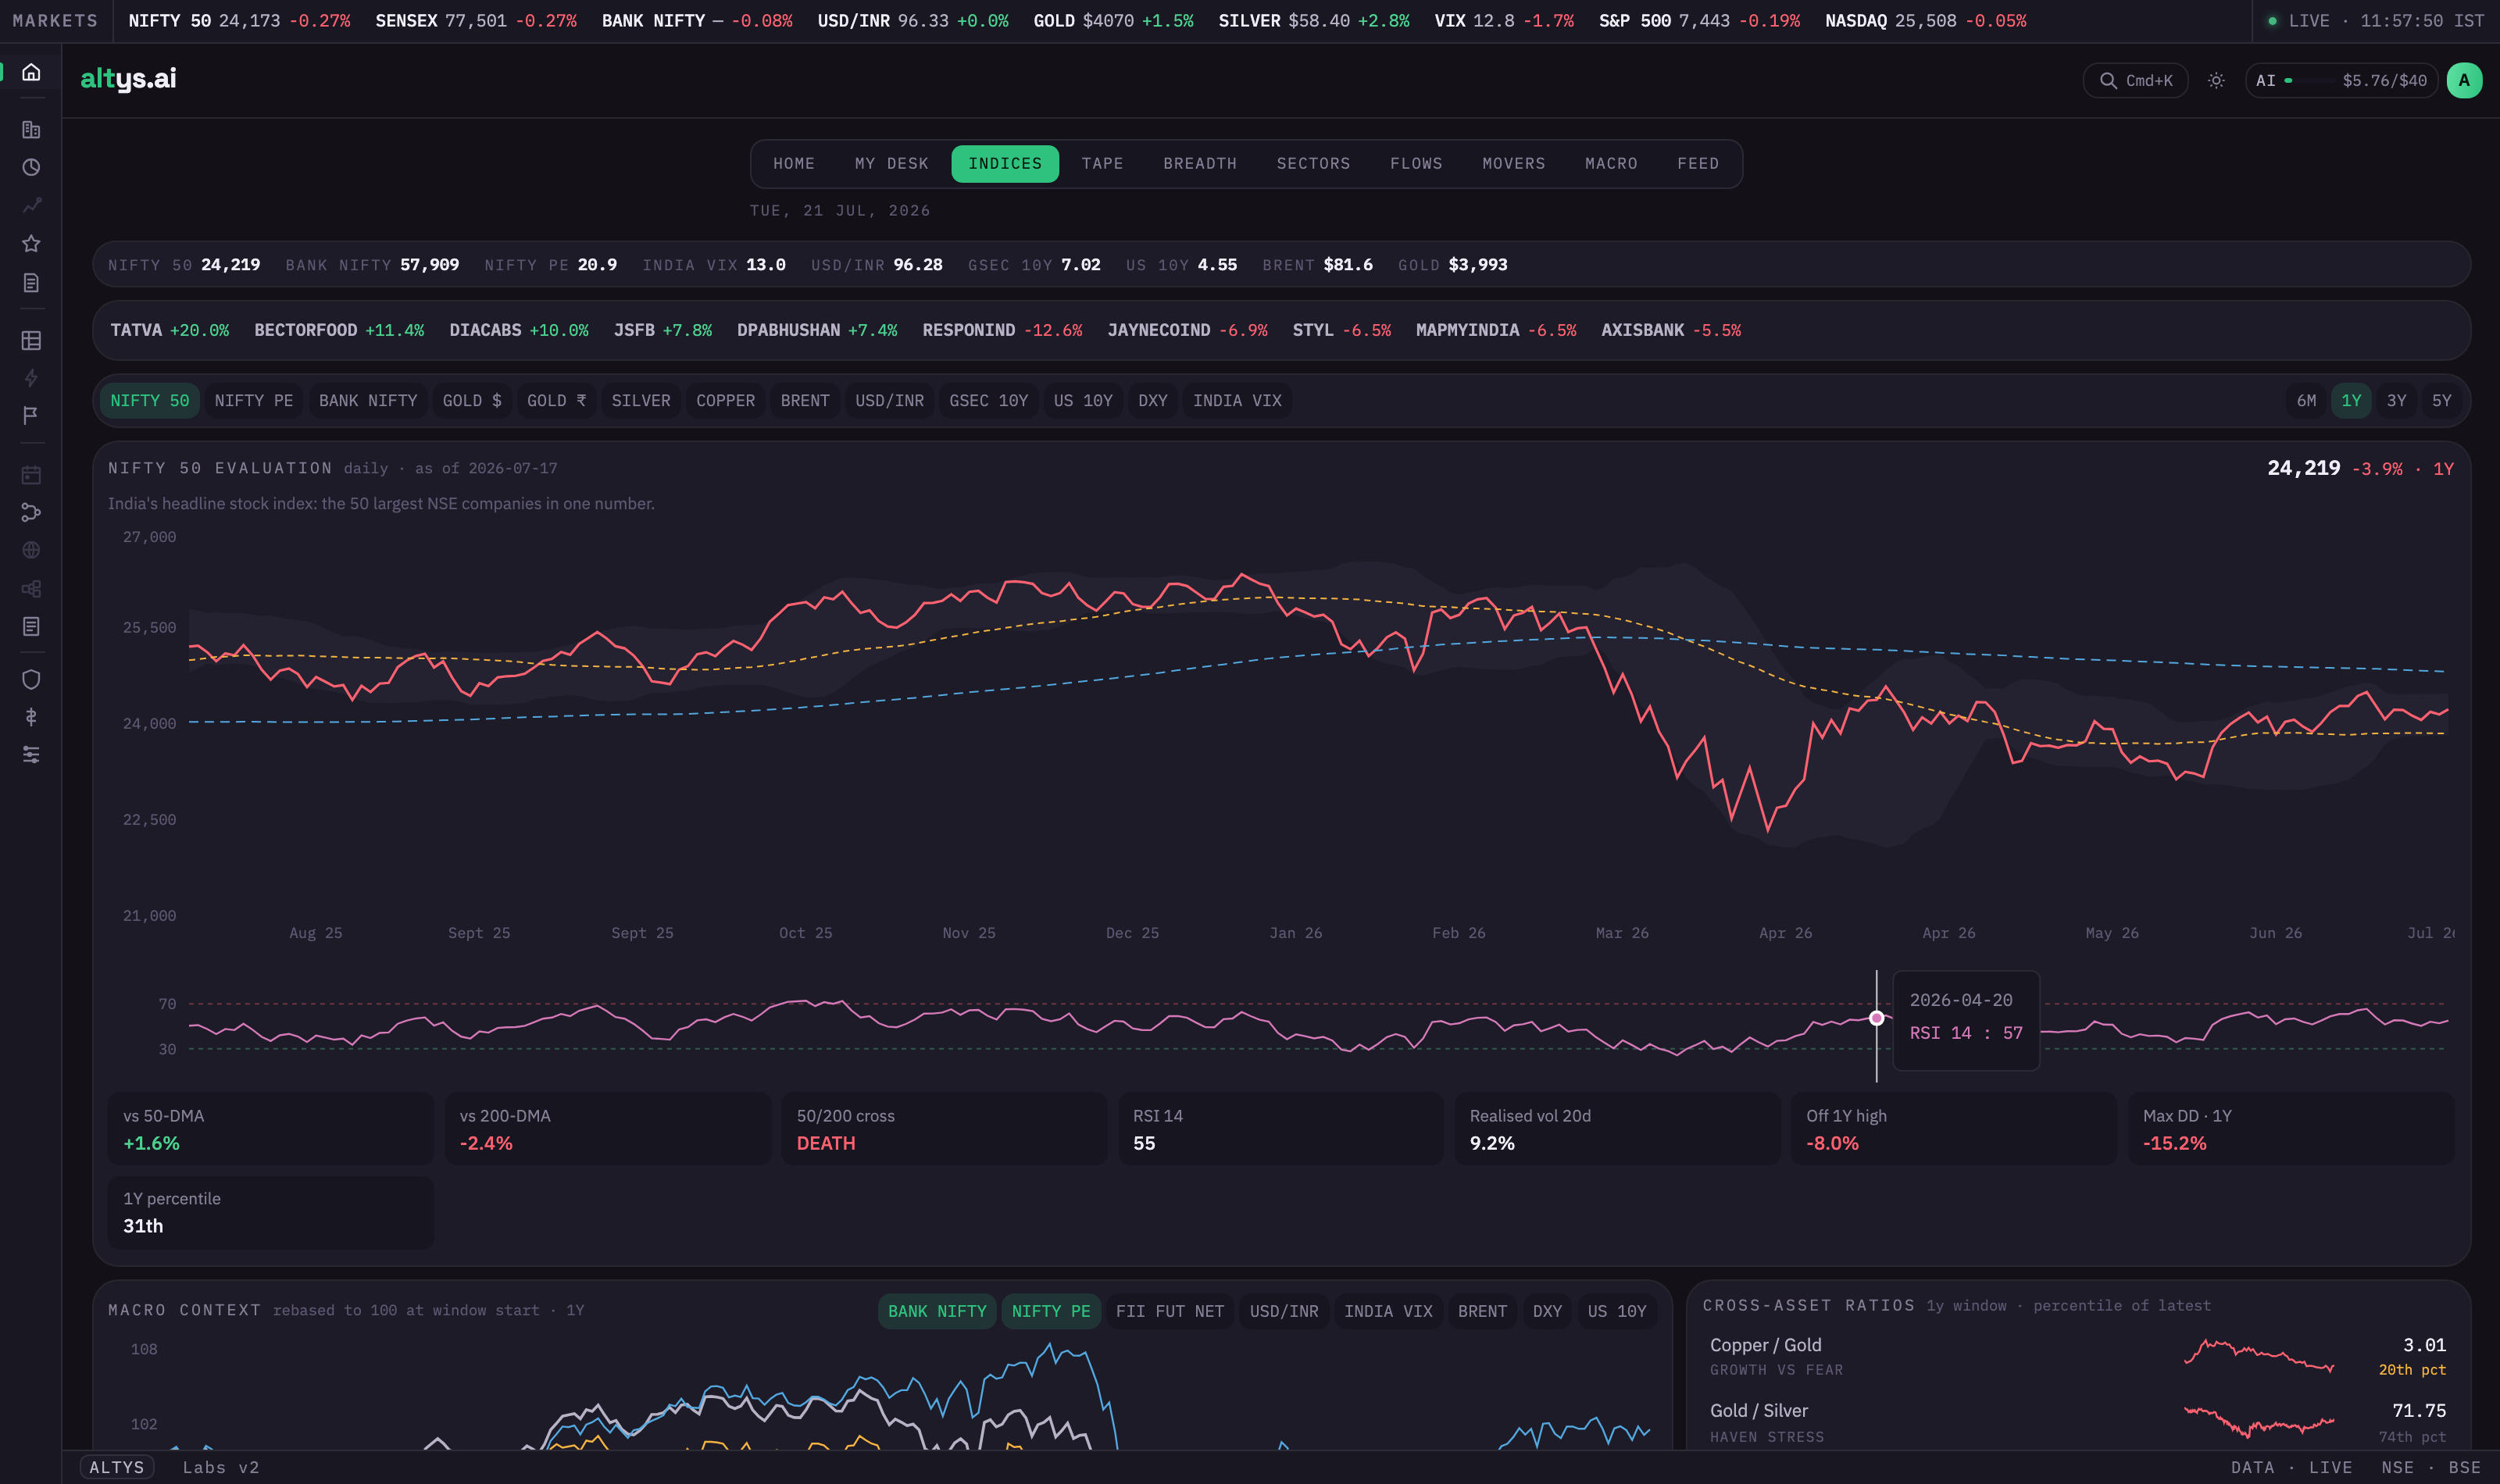
The Indices tab turns any headline series into a full technical read. Pick Nifty 50, Bank Nifty, gold, silver, Brent, the rupee, G-secs, or India VIX, and you get the price with moving averages, an RSI strip, and a row of stats: distance from the 50 and 200-day averages, the 50/200 cross, realised volatility, distance off the one-year high, max drawdown, and where it sits in its one-year range. Below that, a rebased macro-context overlay and cross-asset ratios like copper/gold and gold/silver.
Start your day on My Desk
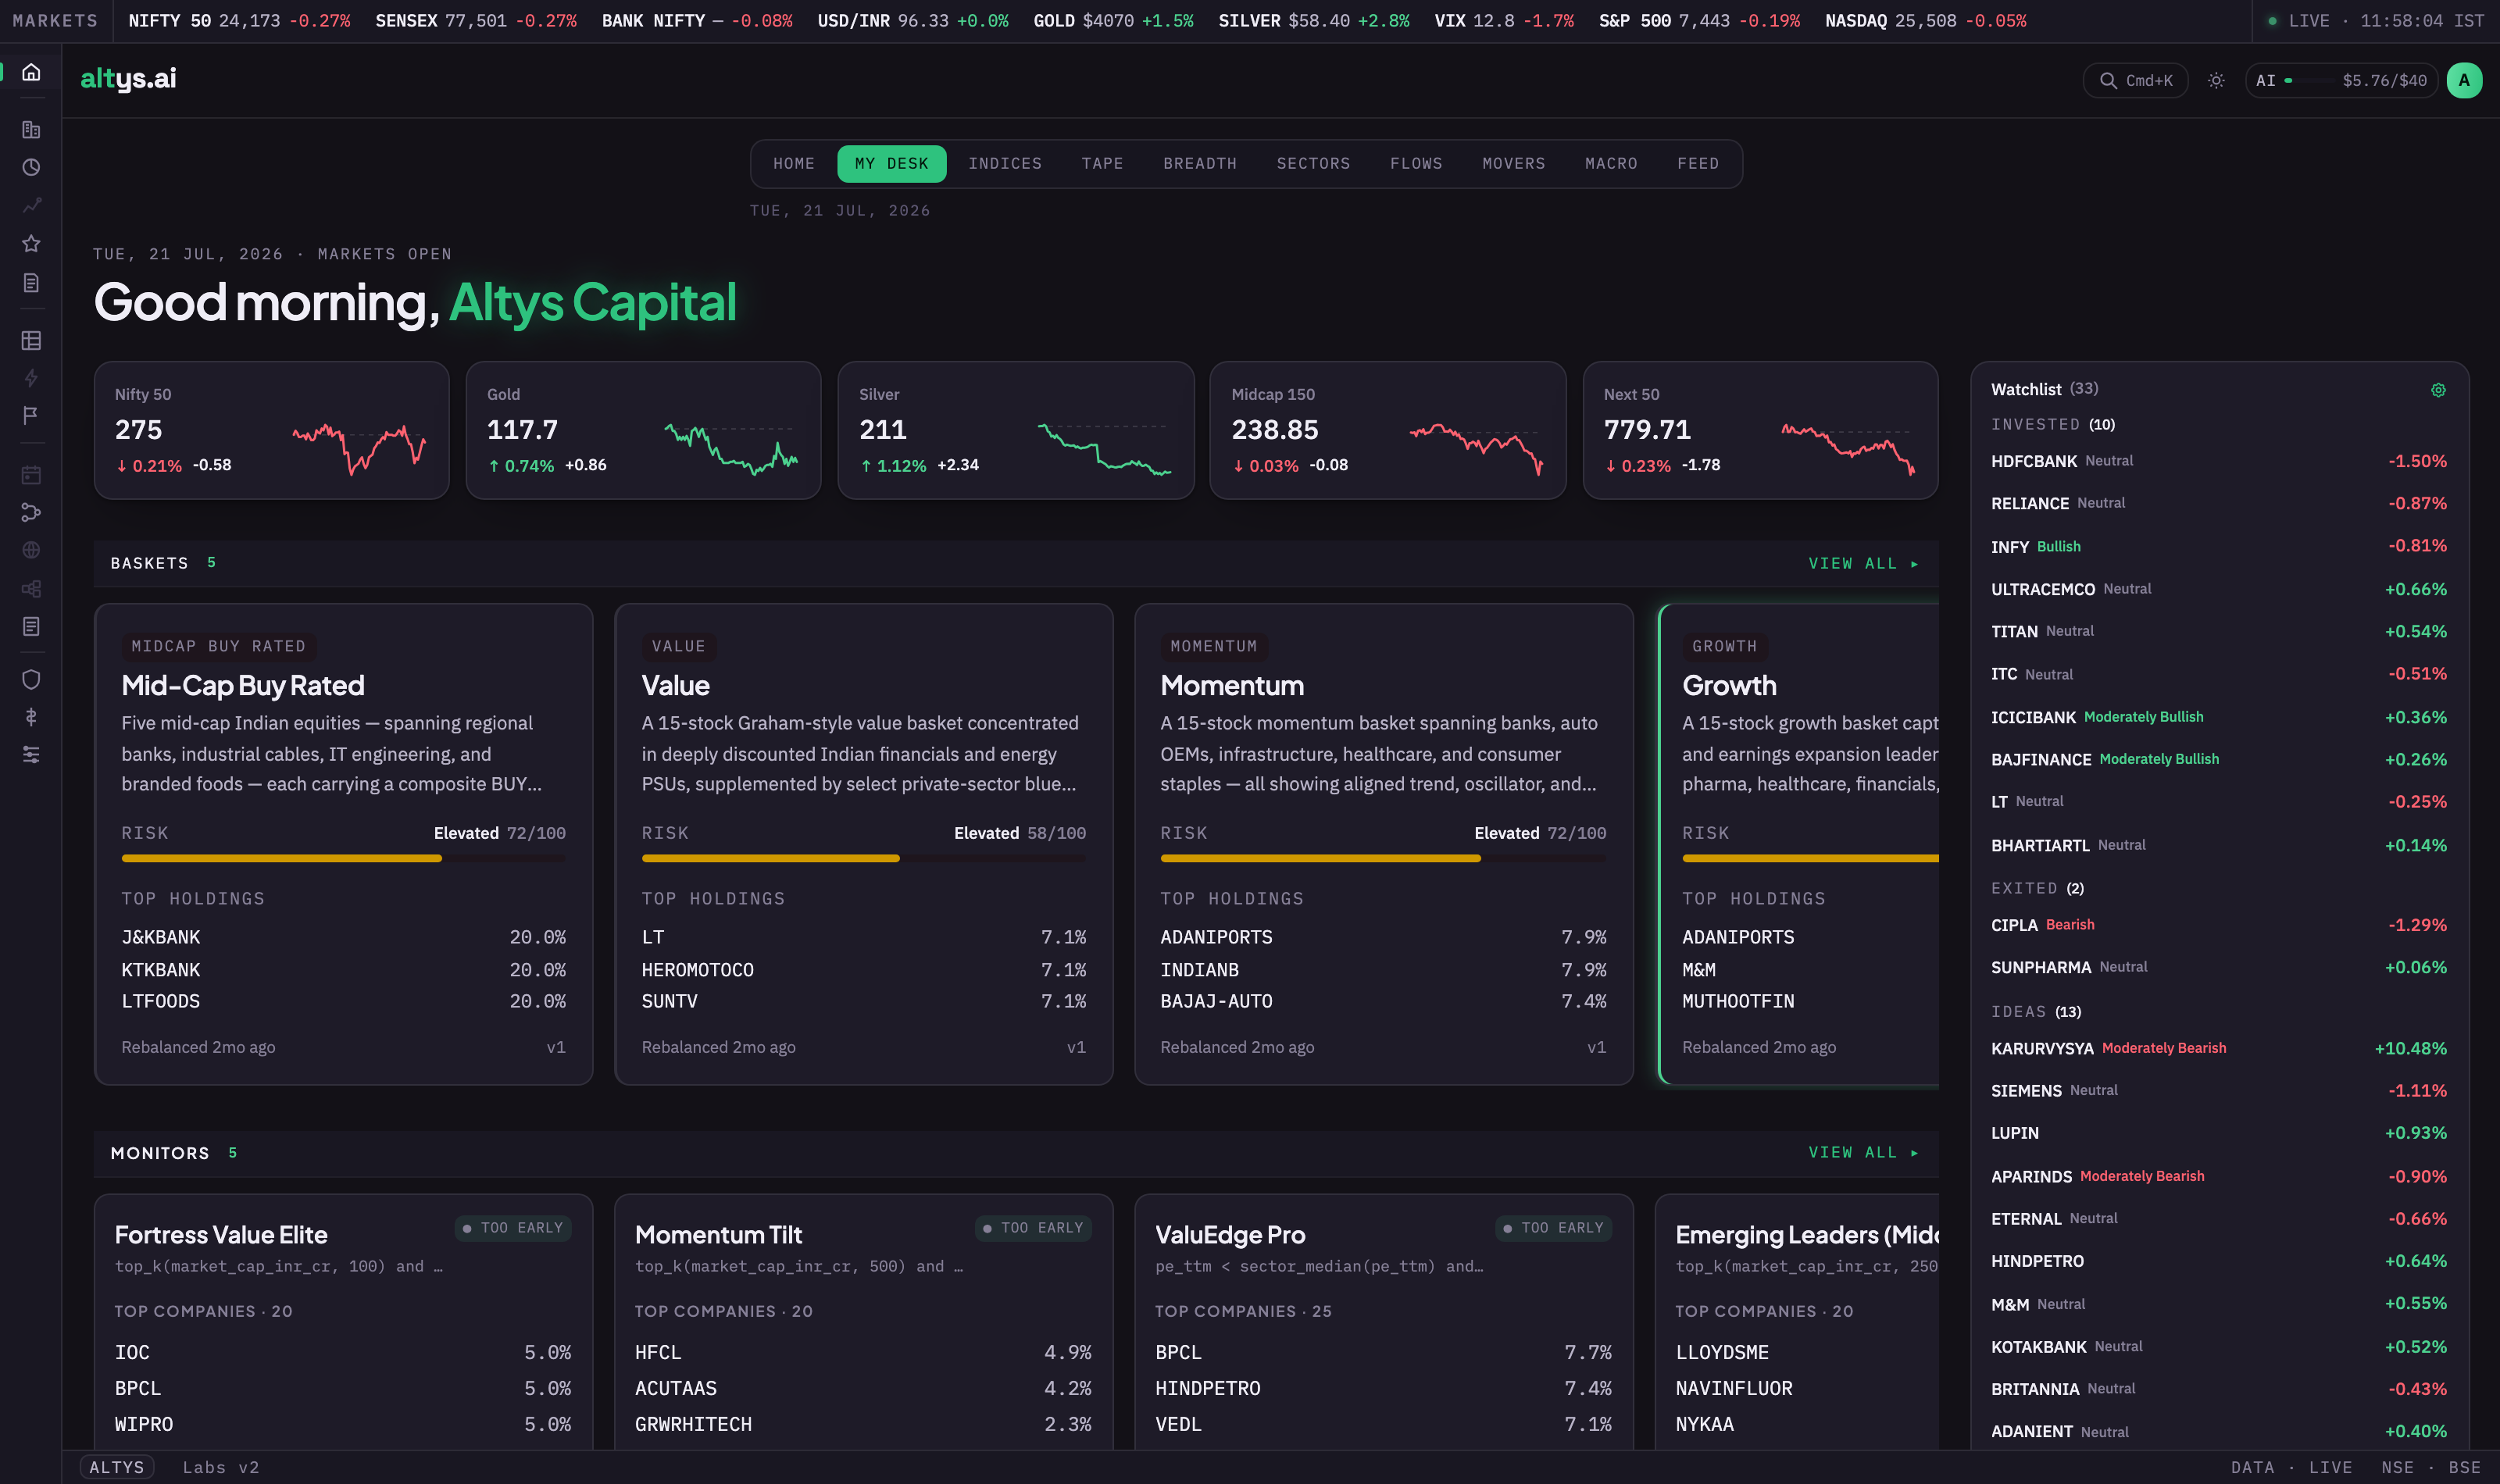
The My Desk tab is your personalised morning view: index cards with sparklines up top, then your baskets with risk scores and top holdings, your active monitors, and your full watchlist down the side with each name's stance and move. It pulls the strategy, monitor, and watchlist work from the other four workflows into one place to open each morning.
Go deeper by tab, or per company
The Flows tab tracks FII and DII activity, Sectors shows rotation, Breadth and Movers cover market internals, and Tape is the live feed. For a single name, the company console carries its own Technicals widget and a Macro widget that shows the company's sensitivity to macro drivers.