Altys Research · India markets
Nifty drivers, 2026-11-04: index move, sectors and market breadth
The Nifty 50 rose 0.63% to 23,960.6 between the closes on 2026-11-03 and 2026-11-04. This report separates observed index performance, sector participation and institutional flows from explanations that require further evidence.
Market session: 2026-11-04. Prepared from observations retrieved 2026-11-05. End-of-day data, not live quotes.
The session in three observations
- Nifty 50 rose 0.63% over the two dated closes.
- NIFTY OIL & GAS had the strongest return among the sectors shown (+1.54%); NIFTY IT had the weakest (-1.5%). This comparison does not measure index-point contribution.
- Nifty 50 breadth recorded 35 advancing and 15 declining securities. The count describes participation within the covered members.
What changed in the indices?
| Index | Previous close | Latest close | Price change |
|---|---|---|---|
| NIFTY 100 | 24,739.5 | 24,942.35 | +0.82% |
| NIFTY 50 | 23,810.85 | 23,960.6 | +0.63% |
| NIFTY 500 | 22,520.35 | 22,769.2 | +1.11% |
| NIFTY AUTO | 26,201.95 | 26,504.8 | +1.16% |
| NIFTY BANK | 55,540.05 | 55,913.6 | +0.67% |
| NIFTY FMCG | 45,580 | 46,264.05 | +1.5% |
| NIFTY IT | 32,551.6 | 32,061.9 | -1.5% |
| NIFTY OIL & GAS | 11,008.55 | 11,178.2 | +1.54% |
| NIFTY PHARMA | 27,218.5 | 27,333.45 | +0.42% |
NSE file for 2026-11-04 · NSE file for 2026-11-03 · Download chart inputs (CSV)
Which sectors participated?
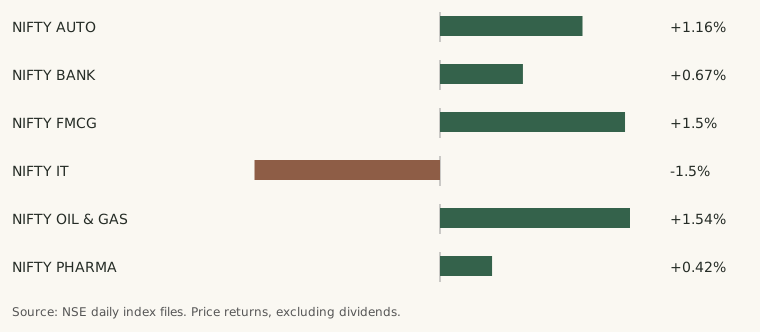
These are selected sector-index returns, not contributions to Nifty points. A sector move alone does not establish a change in company earnings.
Was participation broad?
| Universe | Advancing | Declining | Unchanged | Traded members |
|---|---|---|---|---|
| NIFTY100 | 78 | 22 | 0 | 100 |
| NIFTY50 | 35 | 15 | 0 | 50 |
| NIFTY500 | 408 | 88 | 0 | 496 |
| NSE_ALL | 1,953 | 601 | 32 | 2,586 |
Breadth is calculated from constituent closing observations. Missing or untraded securities can reduce the covered universe. It measures participation, not the reason for a move. Breadth methodology and limitations.
What do institutional flows show?
| Observation date | FII net (₹ crore) | DII net (₹ crore) |
|---|---|---|
| 2026-11-04 | 7,284.03 | -3,712.23 |
Exchange cash-market flows may be provisional and are distinct from depository investment statistics. Their observation date is shown independently. They do not identify the buyer or seller behind each index-point move. NSE FII/DII reports.
What can explain the move?
The observations above establish what moved and how widely stocks participated. They do not establish a single cause. Company disclosures, policy decisions and global events require dated primary evidence before being connected to this session. Stock-level point contributions are unavailable here until effective constituent weights are verified.
Company results to investigate
Read the dated earnings calendar and the company financials directory. A calendar date is not proof that a result has been filed. Reported results and scheduled events must remain distinct.
Questions readers ask
Why did Nifty rise or fall?
The observed closing change is +0.63%. Sector performance and breadth describe the move; a causal explanation requires separate verified event evidence.
Are these live prices?
No. These are closing observations for the dates printed above.
Does this report recommend an ETF or stock?
No. It provides dated market evidence and educational context.
Early-November market participation analysis · Foreign-flow context · How to read market breadth · Index funds and ETFs